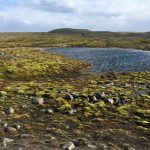
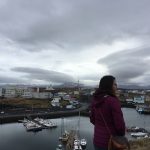
My journey in cartography began in my third year with GEOB 270. It was my first class using GIS and map making was challenging. Prior to this, I had a strong background in visual arts and design from high school. Therefore, the visualization aspect of data was not difficult, but the technicality in data analysis was something I needed to improve on. This class was the first step for me to understand basic cartography principles such as map projections, coordinate systems, spatial units, scales, vector vs. raster data sets. The maps below is one of the first assignments I completed for this class. I enjoyed learning about different classification methods through this process.
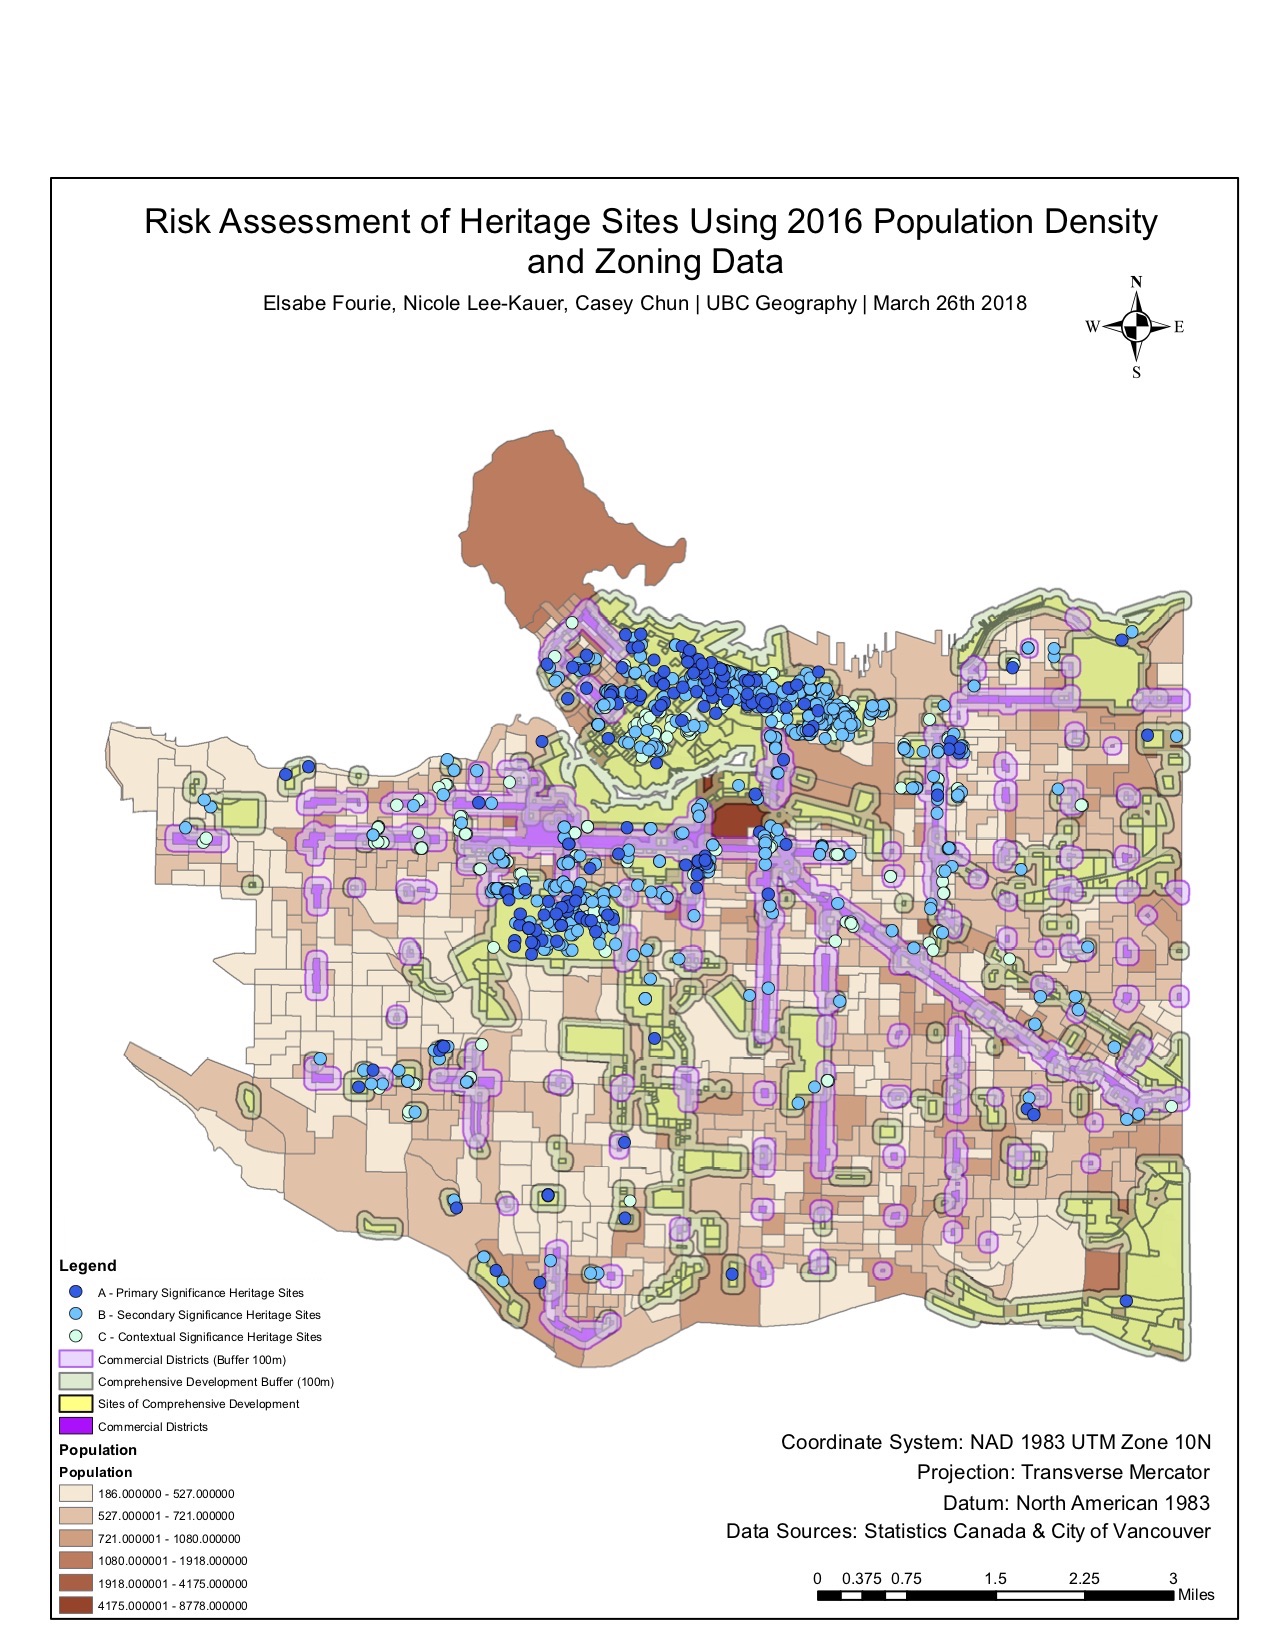
For my final project in 270, we created a series of maps showcasing heritage sites across Vancouver. This project was my first approach in storytelling through map making. The risk assessment gave me an opportunity for learning to use layers to incorporate choropleth, polygon, and point data. From working in a group setting, I found it was difficult to communicate my visualization of data. However, we were efficient and the project was quite successful.
Coming into my fourth year, I continued my cartography journey with this class and GEOB 372. By taking both classes at the same time, I was able to incorporate my knowledge in interactive mapping and data visualization for my class projects. For this class, one of the earlier assignments was using leaflet.
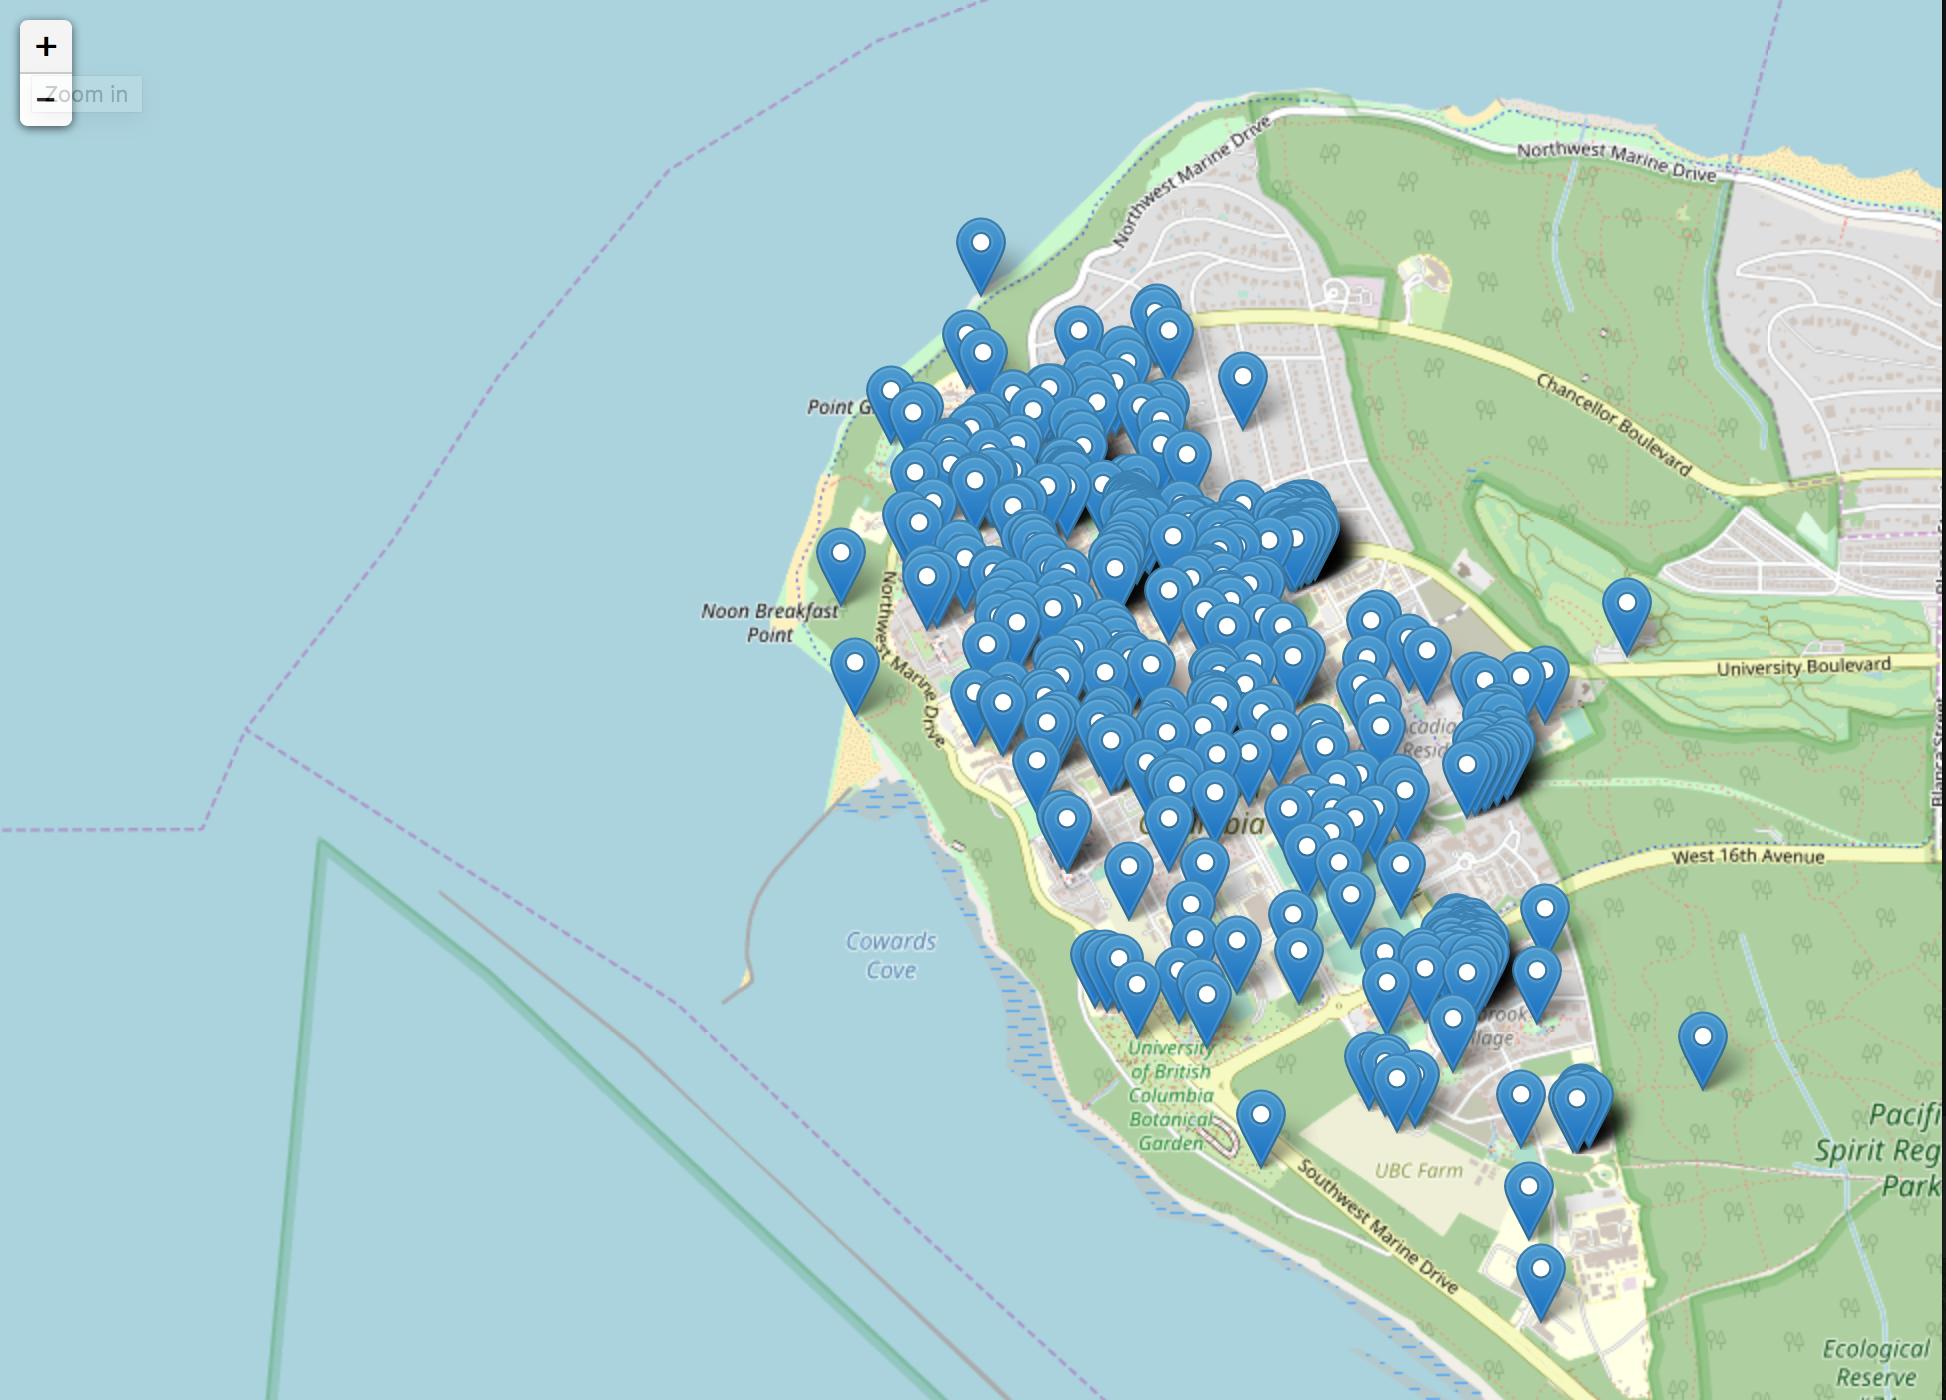
Before coming into this class, I had very basic knowledge of html and javascript from my previous work experiences. I had learned to read html through looking at Shopify coding, so even creating this map was very challenging. The aspect of this exercise that I found most challenging was the self-guided approach. Through lab instructions in other mapping classes, I usually have a pretty good idea of the technicality. In this class, however, we were introduced to using new platforms, new coding systems, new visualization techniques constantly. I struggled with this assignment for a long time because I was not used to approaching new material on my own. I didn’t know anyone from the class so I felt unsupported and isolated through the process.
As with any new challenges, I tried my best to work independently. Through reading what felt like 20 odd tutorials, I began to understand a new terrain of knowledge system. For instance, I figured out I needed a user-friendly text editor, so I downloaded Atom for this assignment. I realized I didn’t quite understand different file formats, such as Geojson, html, csv and how to incorporate them into one system. So I spent time trying to understand how they are different from one another.
This was the first map I made in this class that made me feel rewarding. I learned a few things about myself from this exercise. Firstly, coding requires a lot of problem solving and resilience. This was the most frustrating and fascinating aspect of my experience with this class. Secondly, I have to accept that there will be unexpected issues that arise from all the exercises in this class, and that I have to let go of my normal way of working through assignments. In most other classes, I am intellectually challenged but I often know how to navigate through my workflow. I am diligent in scheduling and time management. With this class, however, the knowledge system is vastly different from my own experience that I need to be patient and forgiving that my learning process might not align with deadlines and calendars. Lastly, I began to see the power in visualization of data and aspects of interactivity. This exercise sparked my curiosity to explore the problem solving side of me that I have tucked away after my design classes in high school. Design and Cartography are similar disciplines in which they both require knowledge in science and arts. I used to believe I can only choose one or the other, even though I had strengths in both sciences and humanities. However, now I see myself incorporating both aspects of knowledge in my career.
This map above was the lab I did before my final project. Unfortunately, my laptop was damaged during reading break and I had to delay my submission for this project for quite a while, which also puts me behind on other class assignments to come. Nevertheless, I was very happy with the result of this map. I learned that with some patience and resilience, I can accomplish what I set out to do with coding. This map assignment was very important in helping me accomplish the final project. I was able to work a lot faster for my parts in the final project because I had worked through this project on my own. I found I understood mapbox much better than my classmates, and was able to apply my data visualization skills in a constructive way.
As the semester come to a close, I want to take this opportunity to thank my professor, Luke Bergmann for being patient and understanding of my learning process. As much as I struggled through this class, I gained insight in my personal growth and academic capabilities. I learned that cartography is not only a visualization and analysis tool, but it is very powerful in communicating greater systematic issues such as income inequality, environmental injustice, racism, sexism, and a myriad of issues. I feel equipped to apply my knowledge in a professional setting.