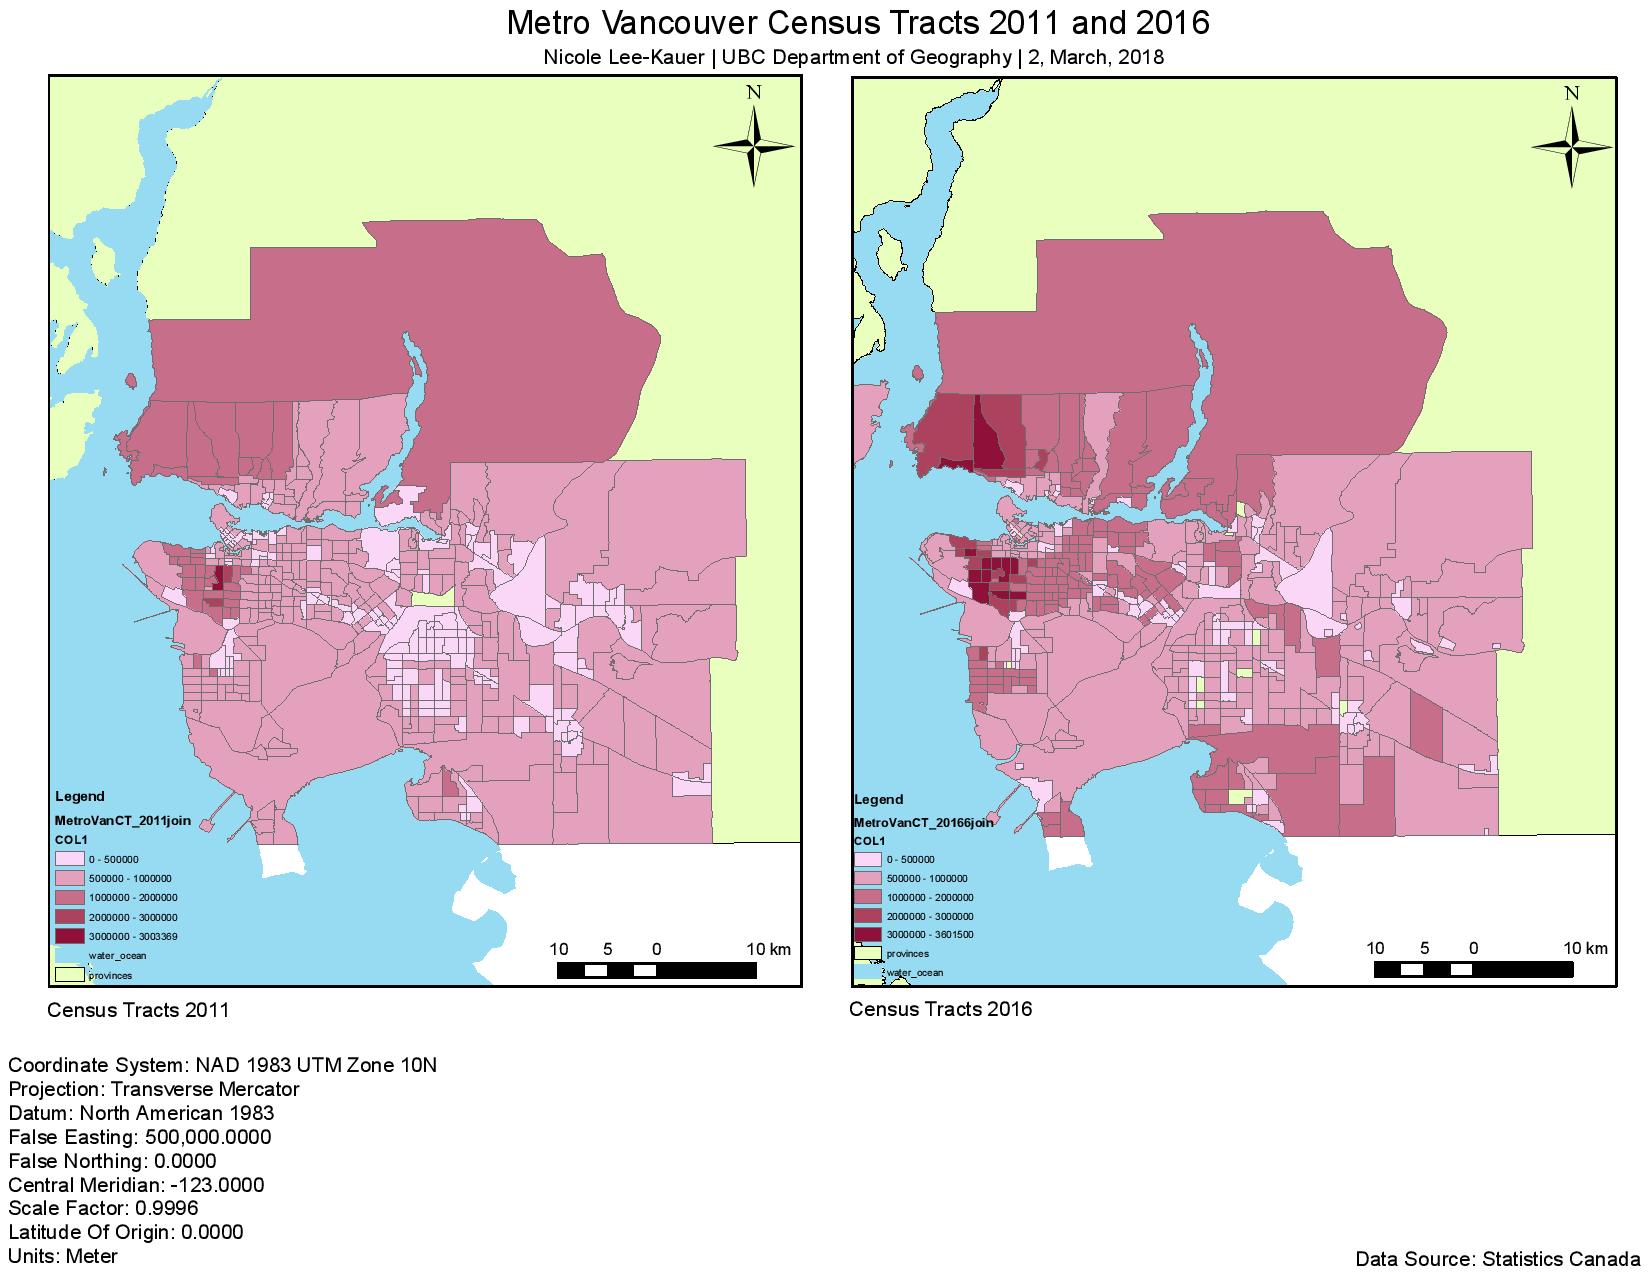
In my study for Housing Affordability in Vancouver, I made a comparison map between census tracts in 2011 and 2016. The data shown is taken from the median of shelter costs, meaning that each census tract is taking the middle value of the data set in the area. This data is taken from Statistics Canada, which the tabular data was processed by University of Toronto. The problem with looking at only this variable is that it is not very useful for renters to look at how much of their income would be spent on housing. However, it is useful for people who are looking to buy houses in Vancouver.