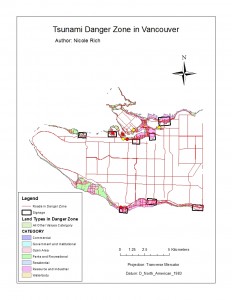
Answer from Question 5: What percentage of the city of Vancouver’s total area is under danger. Explain the method used to determine this percentage.
- Right click Vancouver_Danger layer
- Select Attribute Table
- Right click Shape_Area
- Select Statistics
- Here, you can see the Sum of all of the shape areas (15889260.283541m2)
- Next, right click on Vancouvermask and then Attribute Table
- Here, you can get the total shape area under the Shape_Area column (131033339.950334m2)
- To find the percentage, divide the sum of all of the shape areas in the Vancouver_Danger layer by the total shape of the Vancouvermask layer
- 283541m2 / 131033339.950334m2 x 100 = 12.126120184%
Therefore, the percentage of the City of Vancouver’s total area in danger is 12.126120184%.
Answer to Question 6: List the healthcare and educational facilities within the Vancouver danger zone, if any explain how you came up with your answer.
- Go to ArcMap toolbar and select Selection
- Click Select by Location
- Selection method should be ‘select feature from’
- Target layer(s) are Vancouver_health and Vancouver_education
- Source layer is Vancouver_Danger
- Spatial selection method for target layer feature(s) is ‘interest the course layer feature’
- Click Okay
- Right Click on the Vancouver_health layer, then select Data and then Export Data
- Ensure that you are only exporting ‘Selected features’ and using the same coordinate system as ‘this layer’s source data’
- Rename the Output feature class health_danger since these are the two layers that are being intersected
- Repeat for the Vancouver_education layer
Educational facilities in the Danger Zone:
- Emily Carr Institute of Art and Design (ECIAD)
- Henry Hudson Elementary
- False Creek Elementary
- St Anthony of Padua
- École Rose des Vents
Health facilities in the Danger Zone:
- False Creek Residence
- Villa Cathay Care Home
- Broadway Pentecostal Lodge
- Yaletown House Society
Accomplishment Statements for each lab:
Lab 1: Studied the basic concepts of ArcGis in order to begin my understanding of the program to best use it in the future in GEOB 270 and future endeavors.
Lab 2: Explored the uses of vector and raster data in ArcGIS in order to produce a map that properly visualizes both to an observer of the map.
Lab 3: Benefited from the use of completing spatial and tabular datasets to manufacture a map that displayed areas of Vancouver that would be at risk if a tsunami were to occur.