Quantitative Data Classification:
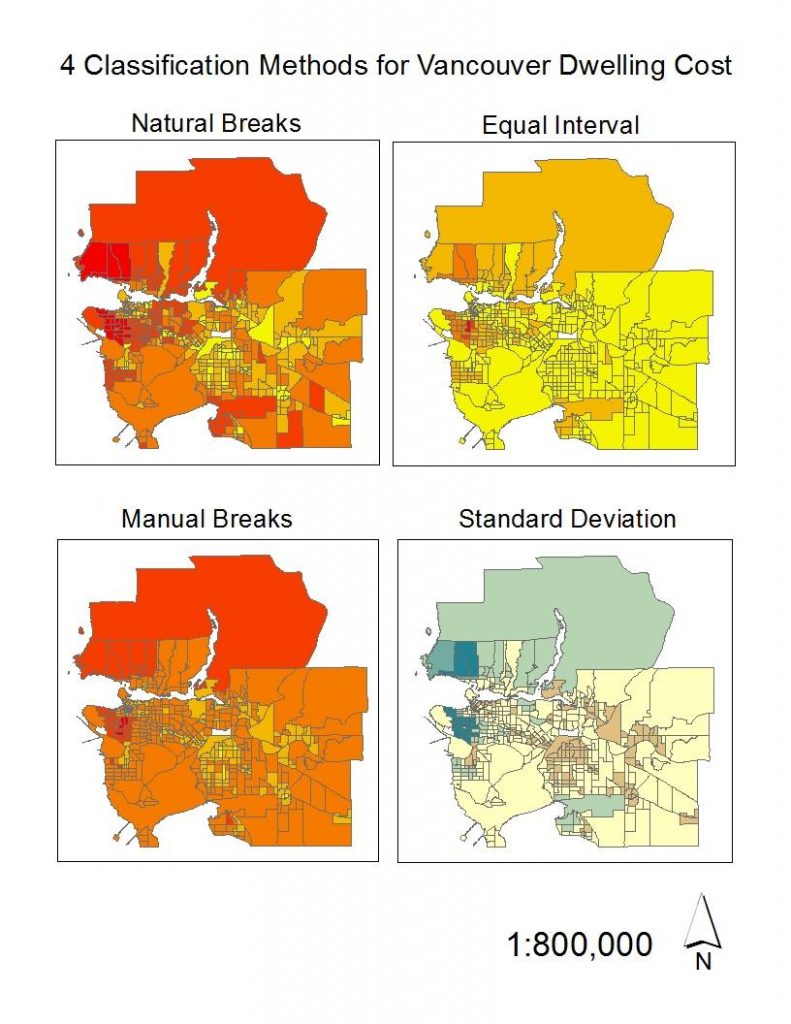
In this lab, I used multiple classification methods when creating maps to learn that different methods of data classification can influence the interpretation of data on maps. The maps below that I created of the cost of living in Vancouver show four different ways of displaying the same data.

The way you show the data matters. You might interpret the cost of living in Vancouver to be different than what it actually is depending on which map you are shown. The natural breaks and manual breaks maps make Vancouver look severely unaffordable, but the equal interval map makes it seem as though Vancouver is actually quite affordable. So if I was a real estate agent I would most likely use a map that looks like the equal interval map in order to convince people to buy property in Vancouver by presenting it as cheaper than it really is.
Housing Affordability:
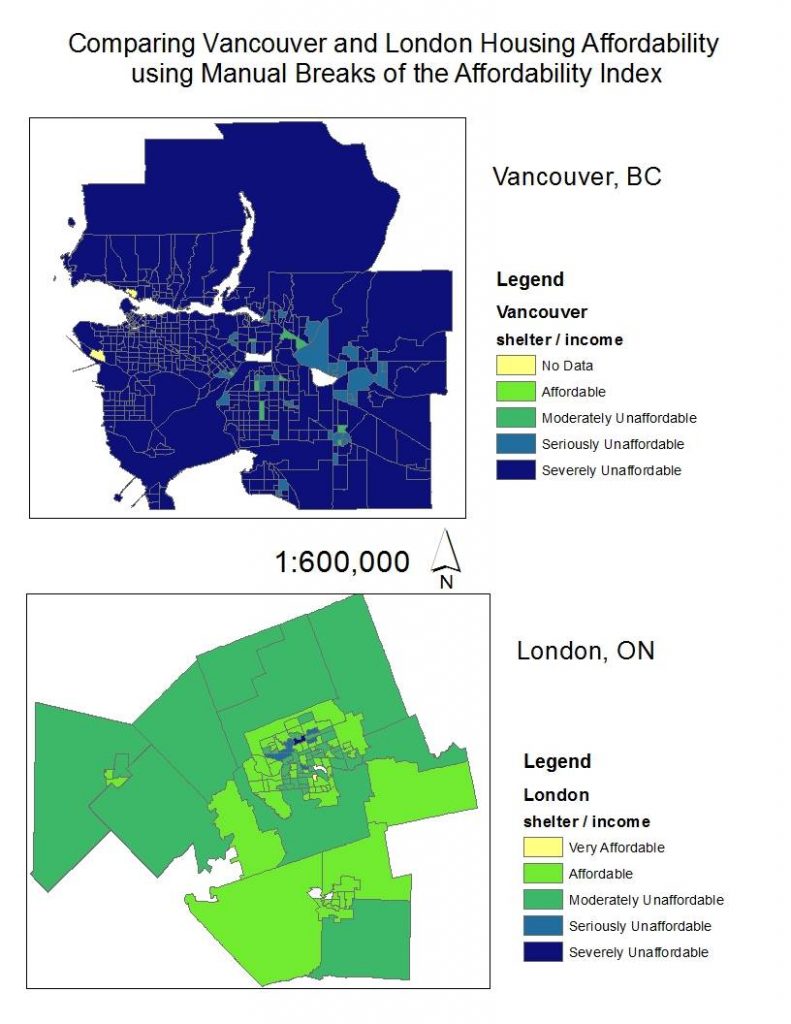
Here are maps that I have made in order to compare housing affordability in Vancouver to London:

Housing affordability is different than just house cost. Affordability is the house cost normalized by residents’ income. This makes it more fair to compare housing cost between cities whose residents have different levels of income. And since Vancouver is a big city and London is a smaller city, people will have generally higher income in Vancouver. So we would expect also that housing prices would be higher where there is higher income, but looking at the map, it is clear that even though people in Vancouver have higher income levels, the houses are still priced way too high to be considered affordable.
The way that affordability was determined was by using the ratings provided on the Demographia International Housing Affordability Survey 2017. You can see the 5 categories in the legend on my map. I think that, for what they are, these can most likely be trusted, and Demographia seems like a reliable source. However, the question I have is whether or not using price normalized by income is the best way to determine affordability. In Vancouver, it is well known that housing prices are driven up by foreign buyers with massive wealth, and their income is not reflected in calculations of local income. And income is not the only factor playing into what house a person can afford: think about savings, or inheritances. So we have to keep in mind that while Demographia’s affordability categories can give us some idea of the affordability of a region, there are other factors to keep in mind.
Affordability can be a good indicator of a city’s livability but it is definitely not the only indicator. Other indicators you may want to look for would be low crime rates, good health statistics, low levels of unemployment and homelessness, good quality of education, and even very specific things like if you want to live in a place with lots of bike lanes. Affordability is a big factor that plays into whether or not you can live in a region, but even if you can afford to live there, you may not want to, because of crime rates or poor employment opportunities.