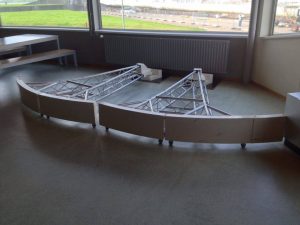
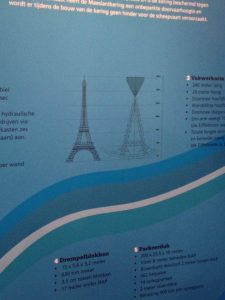
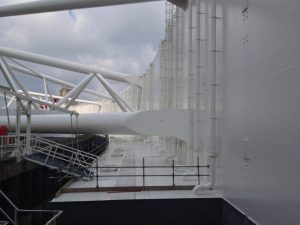
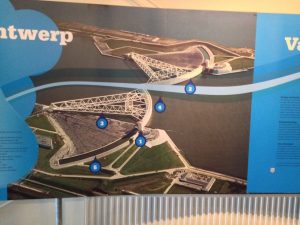
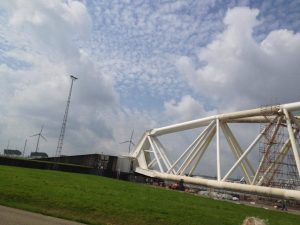
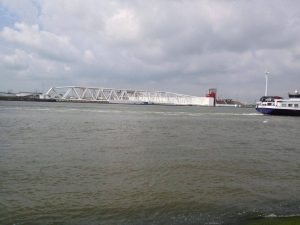
Today we took the bus from Delft to Hoeke van Holland to see the Maeslantkering which are the Sea Barriers. Located in waterway between the North Sea and the port of Rotterdam, this barrier prevents flooding into the mainland of Holland in the event of a storm surge. It is composed of two floating gates such as pictured in the model below, connected to ball shaped joints that connect the gates to the ground on the sides of the waterway which are 10 metres in diameter. Each gate is as tall as the Eiffel Tower in Paris.
We did a tour of the facilities where we learned the following:
- construction started in 1991 and took six years to complete
- construction costed 450 million euros
- when a storm surge of 3 metres above normal sea level is anticipated, the barrier automatically closes
- there has only been one time when they needed to close the gates, on November 8, 2007 although they sometimes close it for running tests

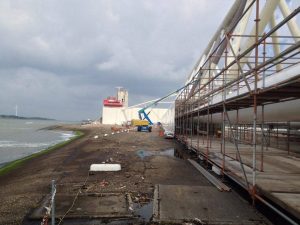
I was really impressed with how massive this project was, especially coming from an engineering background, I thought it was really cool that we could see these massive sea locks in real life.
That afternoon, we had a lecture from Eric Donkers regarding VIA Statistics. He told us all about STAR (smart traffic accident reporting), an app in which makes it really easy to report accidents. His company uses this app to record accident reports so they can work with the data to find black spots and hopefully reduce the number of road deaths and injuries each year. We really need this app in Canada! One can send in a self report, which is really helpful for engineers to be able to make the roads safer, because often minor accidents are never reported and thus, valuable data is lost. Mr Donkers also told us about how they collect speed reports for throughout the Netherlands by getting readings from car’s GPS systems. With the data they receive, they can see which roads have the most speeders and can thus implement speed enforcement measures to reduce the speeders. Finally, he talked about the Bliq Reports that his company makes every four months and gives to the policy makers. These reports show the statistics they collected displayed into a map that shows where all the fatal accidents occurred and where the most speeders are. Not surprisingly, these areas were usually the same, where there were speeders, there were more traffic deaths. This lecture really got me thinking about how technology like this needs to be applied in Canada, so many problems could be fixed and lives could be saved.