Learning GIS through GEOB270 has been such a growing experience for me. Not only has it taught me the necessary technical skills to feel comfortable with the ArcGIS system, but the underlying understanding to be able to use these skills in different mapping systems. It has also given me the ability to have a critical eye when observing maps and an understanding of the importance of ethics when it comes to dealing with data. My main achievement through this course was being able to apply the skills that I learned to develop the final project with my team members.
All posts by nicole stevens
GIS Final Group Project
My group project looked at food accessibility and availability in the Downtown Eastside, Vancouver, BC. Our goal was to analyze and reveal the types of food services that are not available in the DTES, leaving its inhabitants without access to healthy and affordable food.
Our team was organized by having a couple meetings per week before class and dividing up tasks when individuals had time to go into the lab, or work in pairs. We all worked off of one team member’s computer drive and kept an updated Google Doc of our progress, questions and links to data. We also created a Facebook message group to keep each other up to date throughout our progress. We divided up the written report work between the four of us.
I learned some interesting things through this project. I learned how to input addresses into an excel sheet and obtain X, Y values from Geocoder to be able to create a layer of points on a map. This was done for most of our data, as we had to find convenience stores, grocery stores, etc. on our own through Yellow Pages as the City of Vancouver did not have an existing database. I also learned how it can be difficult to organize to work on one map with four other people. Often we had to be creative and quite forward thinking in order to find jobs for other individuals in our group who weren’t directly working on the map during our lab meetings.
Some issues that we ran into with publicly available data was that for the stores, often their addresses were in the available excel spreadsheet, however the X,Y values were not. This forced us to spend quite a lot of time to figure out how to input the address into our map, which led us to find Geocoder. However, Geocoder only works with addresses in Canada and the USA, so that is an important barrier if one wishes to work with data outside these countries.
Check out our final project on the link below:
Environmental Impact Assessment – Garibaldi at Squamish Ski Resort
The Garibaldi at Squamish proposed ski resort as many potential issues, including snowline and protected areas, coming in the way of its development.

The Garibaldi at Squamish project is a tentatively approved ski resort development plan located about 80km North of Vancouver, BC. Northland Properties and Aquilini Investment Group of Vancouver submitted a project proposal for the ski resort under the Environmental Assessment Act in 1997. In 2010, the BC Environmental Assessment Office released its report that stated that there was not enough information on the potential impacts for vegetation and wildlife in the area. As a response to recommendations in this report, Northland Properties and Aquilini Investment Group of Vancouver submitted a follow up document that tried to address these issues. The municipality of Whistler also has its concerns about this project, not only economic but also that there is not enough snow fall in this area. As a natural resources planner, I aim to evaluate these claims and submit my recommendations on priorities and how to move forward for Northland Properties and Aquilini Investment Group of Vancouver.
In order to accurately assess the claims and concerns of both the BC Environmental Office and the municipality of Whistler, I have obtained data on ungulate habitat, old growth forest habitat, rivers and streams, red-listed species, elevation, and roads of the proposed project area from the DataBC. I mapped the habitats and areas where these are found within the project boundary to assess how much area would have to be protected (Map 2). This also included the 555m snow line restriction proposed by the municipality of Whistler. Within the park boundary, 53.5% is made of up protected areas (6.8% old growth forest habitat; 7.9% ungulate habitat; 24.8% red-listed species habitat; 28.1% fisheries habitat). As well, 30% of the project area is found below the proposed 555m snowline.
The two greatest environmental concerns for the Garibaldi at Squamish ski resort project are the potential of a retreating snow line and the amount of protected area needed for fishery and stream protection. Already, 30% of the proposed project area has large concern for not having sufficient snow. With climate change and an average temperature increase, it is expected that in the future the amount of area that is considered in this category will increase. Despite Whistler’s out dated citation (1974) of the snowline, many reports have also addressed the uncertainty of future climate conditions (IPCC 2014; ClimateBC 2017). Although snow making machines could be used, if the temperature is not low enough at these elevations, there is not much to be done to keep the lower areas snow covered. This should be at the top of the list of concerns for Aquilini Investment Group of Vancouver. As well, fish habitat and streams fall into 28.1% of the proposed area. Due to limitations on development in this area, this could quite significantly affect ski run creation. However, forested areas that are left around these areas could be used to provided a buffer of protection for the populations that are present in the streams. As well, allowing skiing in the wintertime within these forested areas could provide low-impact recreation within these buffered forests.
In my opinion, with the total area that needs to be conserved larger than 50% of the projected area, there are two potential options. 1) To increase the size of the amount of developable land for ski runs, the project boundary could be increased. Although there will still be more protected areas included in this increase in area, more ski runs could be available as well. 2) To retract the proposal. With 53.5% of the project locked up in protected areas, the uncertainty of climate in the future and a potential decrease of snow available, the future success of the resort is uncertain.
Personally, I think that with all of the issues already facing this project and in the face of climate change it would not be a smart decision to begin the development of this ski resort. On a more personal note, I love the fact that many mountains in the Howe Sound and beyond region are left untouched and available to enjoy its pristine nature from a far. I think that with Whistler Blackcomb in the area already, it would be excessive to have another resort. As well, there are too many old growth forests, ungulate habitat and important streams in the area that should be protected. Nature is more important than another money making business, and I think that skiers that ski for the love of being in nature and in the mountains would agree.
References:
IPCC. 2014. Climate Change 2014: Synthesis Report. Geneva, Switzerland.
Climate BC. 2017. Version 5.40.
Housing Affordability, Vancouver, BC
Housing affordability differs across Canada. In the map below, the housing affordability is being compared between Vancouver, BC and London, ON.
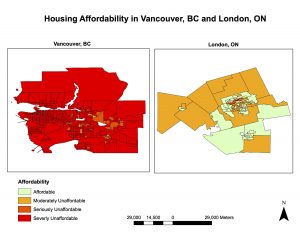
Affordability is measuring the house prices as well as income of different neighbourhoods in both cities. This is a better indicator that housing cost alone as it is total relative to the income people are receiving in the area, of whether it is affordable. For example, houses might be more expensive in Vancouver, than London, but the average income in Vancouver might be significantly higher which actually makes it more affordable in Vancouver than London.
The housing affordability ratings come from the 13th Annual Demographia International Housing Agency Survey: 2017 (http://www.demographia.com/dhi.pdf). This agency seems to be a impartial organization and therefore it’s data and affordable scale should be trusted (below image).
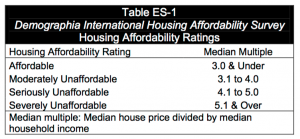
(Demographia International Housing Agency 2017)
I think that affordability is definitely a good partial indicator of a city’s ‘livability’. Although I would not use this information on it’s own to decide whether a city is livable, it is a very important aspect. For example, although Vancouver is quite unaffordable, the benefits of living in a city that is close to mountains, the ocean, has lots of recreation available, and many things to do would make a city for livable for me.
Quantitative Data Classification
Different methods of data classification can influence how the reader understands and interprets the data.
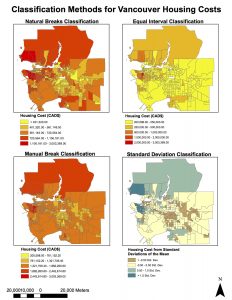
If I was a journalist I would use the Natural Breaks classification. This is because it highlights more red zones, and I would be focusing on how the housing market of Vancouver is not affordable. If I were a real estate agent preparing a presentation for prospect home buyers near UBC I would use the Equal Interval classification. This is because it makes it appear as though the area around UBC has many areas in the low and medium range of housing costs. This however, makes me feels unethical, as these classifications can skew the maps to make provide a purpose, which creates much bias. I do not think it would be ethical to use 2011 data for housing costs in Vancouver because they have increased quite intensely in the last couple of years, so this would be inaccurate data.
Tsunami Areas of Risk, Vancouver, BC
After mapping out the areas of concern for potential tsunamis in Vancouver, the following facilities could be in danger:
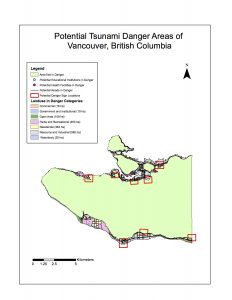
Healthcare facilities at risk: False Creek Residence, Broadway Pentecostal Lodge, Yaletown House Society, Villa Cathay Care Home.
Education facilities at risk: St. Anthony of Padua, Ecole Rose Des Vents, False Creek Elementary, Emily Carr Institute of Art & Design, Henry Hudson Elementary.
This map was produce by creating a two clip layer of healthcare facilities in danger, and educational facilities in danger, the attributes table revealed which facilities were at risk.
The proposed location for the new St. Paul’s Hospital location has it concerns when it comes to tsunami safety.
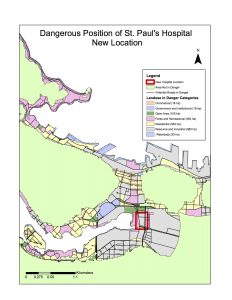
As can be seen from the map, the proposed location is within the area of concern for tsunami danger. Not only is is close to the shoreline, but it has quite a low elevation that would allow it to be at high risk of damage if a tsunami was to reach Vancouver
Spatial Data Models
1.Describe how to fix misaligned and improperly referenced spatial data, including taking into consideration project properties
A map is a flat projection of the spherical earth. In order to display the earth accurately in a map a transformation of data is needed, otherwise continents will be disproportionate to their true size. Sometimes when you are trying to create a map you need to combine different layers that are are based on different coordinate systems. This makes things difficult as it distorts the image and can give false information in a map, as different coordinate systems project the earth in different ways. Through the software ArcGIS, you can create a new version of data for each layer to make it so it follows the same coordinate system. This ensures showing the same map projection for each layer and that they align nicely.
2. Discuss advantages to using remotely sensed Landsat data for geographic analysis.
Not only is Landsat data FREE and is accessible for developing countries who might not otherwise be able to afford remote sensing, it has moderate spatial resolution which means you can have regional detail in your images (not fine resolution). As well, you can always find up to date images as it travels around the earth in only 16 days