The constraints that we have chosen are based on the requirements suggested by Hong and Moller, in an article published in The International Journal (2011). They suggested that areas most suitable for offshore wind energy should take into account of oil and gas platforms, visibility, protected ecosystems, and submarine cables and pipelines. Because the maximum wind speed in the dataset is only 12.48m/s, we do not need to include a maximum of 60m/s (limit for class I turbines) (Level, 2017), as well that we have accounted for visibility of 10km as based on China’s own regulations (Carbon Trust, 2015), therefore, our constraints in this section will be oil and gas platforms, protected ecosystems, and submarine cables and pipelines.
For the gas and oil fields, in order to avoid building on the areas, we created a 0.5km buffer around the platforms, the value chosen was based on Hong and Miller’s article on offshore energy potential (2011).
We then merged the buffered layer using the Union Geoprocessing Tool with a shapefile of China’s exclusive economic zone (EEZ) (Fig. 4).

fig. 4 Oil and Gas Fields
As for protected ecosystems, similar to oil and gas platforms, we prescribed a buffer of 5km to the areas based on suggestions from Hong and Miller (2011). Akin to the process of the previous layer, we also merged it with the EEZ layer. However, the areas are extremely small, and are only visible once zoomed in (most visible are areas in the central and southern shoreline of China)
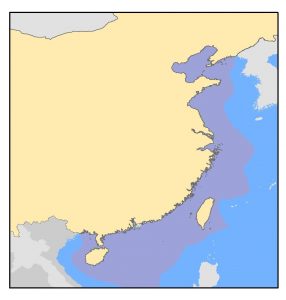
fig. 12 Nature Reserves
The last layer to avoid would be submarine cables and pipelines. In total, we included all cable systems that land in China. The data was found on Telegeography, totaling a number of 13 submarine cables. Per the suggestions of Hong and Miller, we implemented a buffer value of 0.5km to the areas. However, because the datasets were originally polygon layers, we had to convert them to raster datasets using the Conversion tool.

fig. 5 Submarine Cables and Pipelines
After the layers were merged with the exclusive economic zone (EEZ) of China to create the range that will be included, using the Reclassify tool, we assigned values of 0 to all the identified constraint layers and 1 to the rest exclusive economic zone so that we could differentiate between the constraints and the EEZ (fig. 13)

fig. 13 Final Constraints
This was done by overlaying our Weighted Multi-Criteria Evaluation with our Equal Weighted Multi-Criteria Evaluation obtained from the Weighted Sum Tool separately onto the map by using the equation of:
“MCEWtd” * “EEZ_merge”
To remove constraint areas that intersect with both our MCE results of equal weight and weighted