
Task 9 – Network Assignment
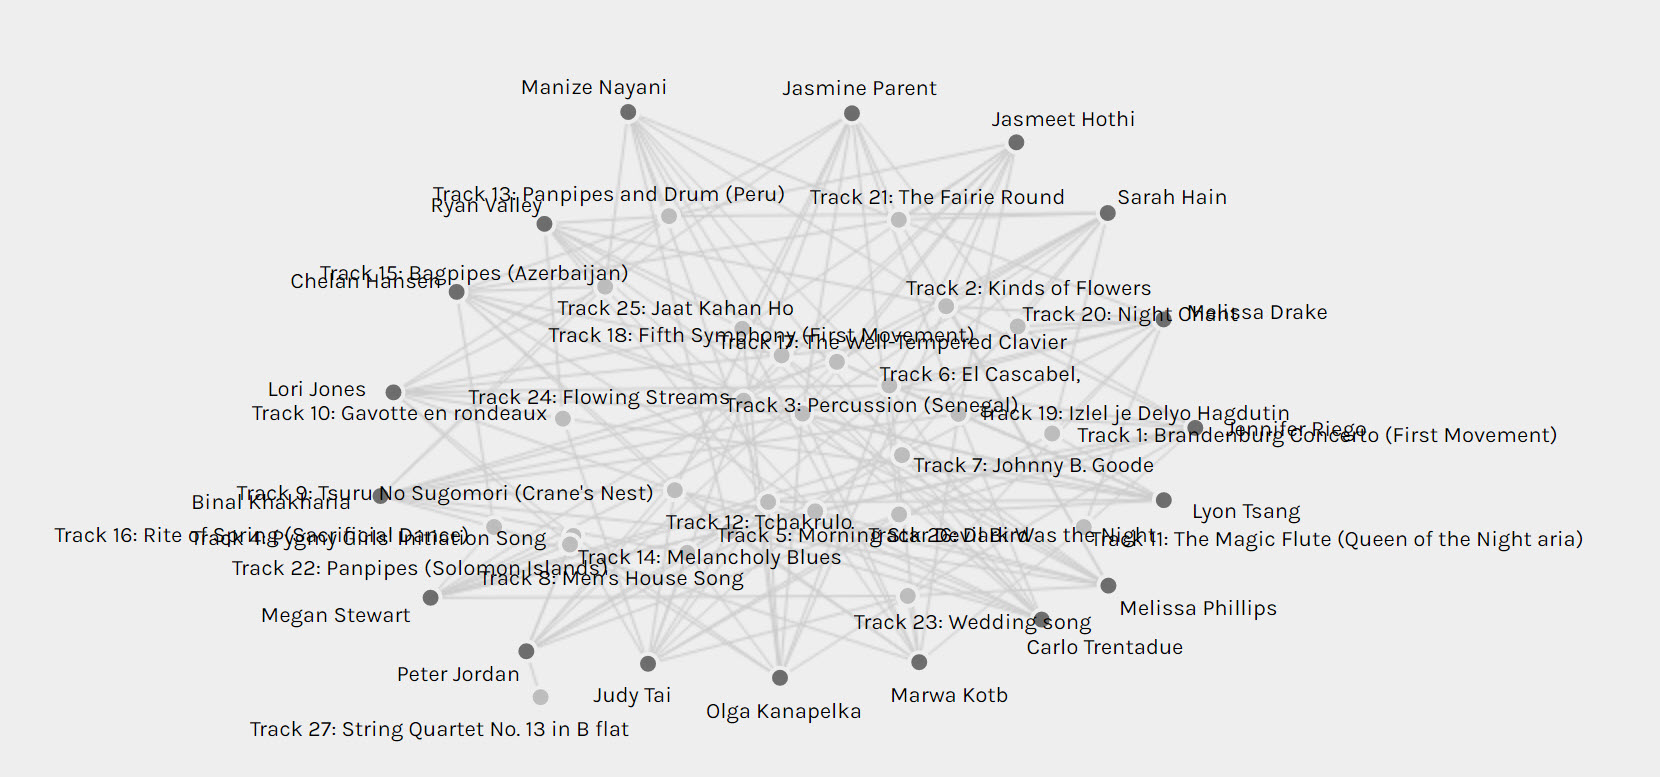
Intrigued by the task, I initially spent quite a bit of time playing around with the Palladium graph, studying the groupings, reconfiguring the networks, checking and unchecking different boxes in the menu, and creating countless screenshots, like this group screenshot below.
Once I felt I was starting to have more questions than answers, I turned to the reading materials on p. 9.1 seeking information to help me frame the answers. The videos on Networking Theory were helpful in providing some background knowledge and some key vocabulary on network theory. The readings were good for helping me see the bigger picture behind the task.
The 65B Network
Our network consisting of 18 students (nodes) was connected based on the song choices we made last week in the Golden Record Curation Assignment.
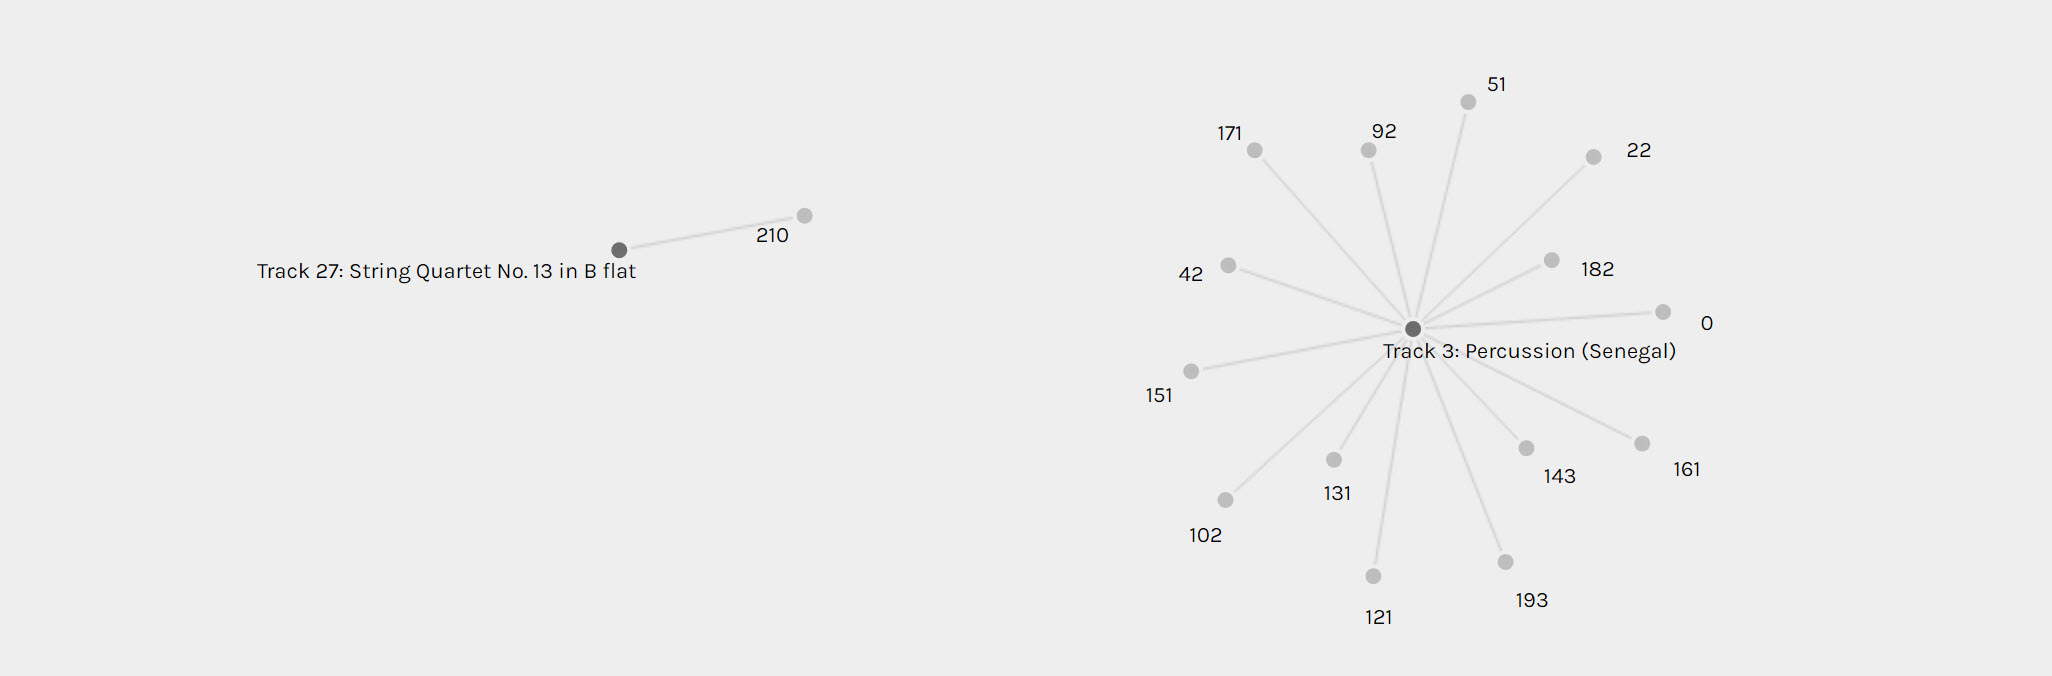
In our larger group, track #3 had the highest degree of connectivity (Systems Innovation, 2015), with 14 selections. On the other hand, Track 27 was only chosen once by Peter Jordan. When I turned to Peter’s blog to read why he chose this song, I learned he randomly selected his whole list. Due to his random choice strategy, he also did not choose the most popular track #3.
Based on criteria that I was not able to identify (hoping to find the answer in someone else’s post!), we were further divided into groups for easier processing.
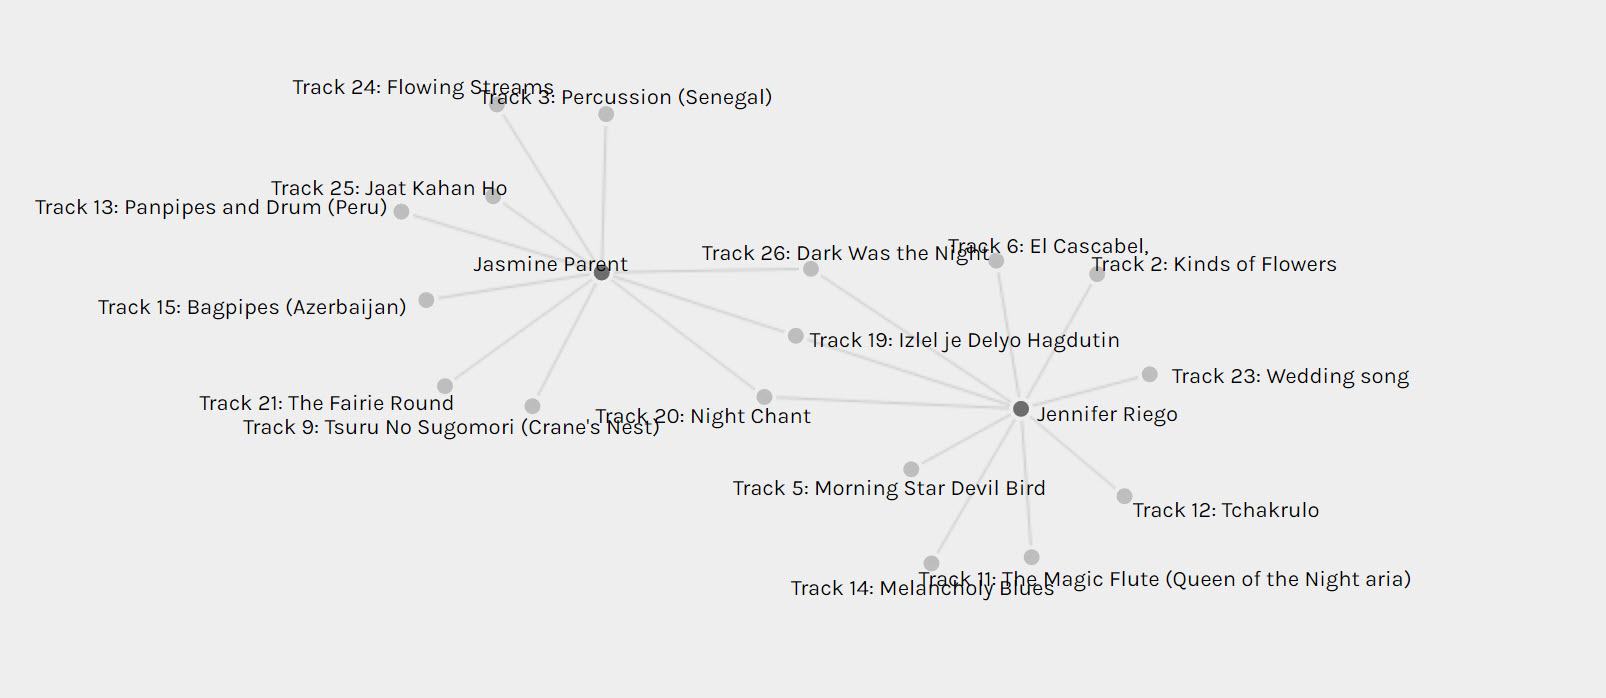
Group 1 was quite unique since it showed a network formed between the two coursemates – Jennifer and Jasmine, who had only three tracks in common. There was nothing special or unique about these three tracks – all of them had the weight of 5 to 7. When I compared my song choices with Jennifer, I found out we were connected by four songs, which was not represented in the groups. So until I find a better answer, I will be considering the groupings to be accidental.
Group 5:
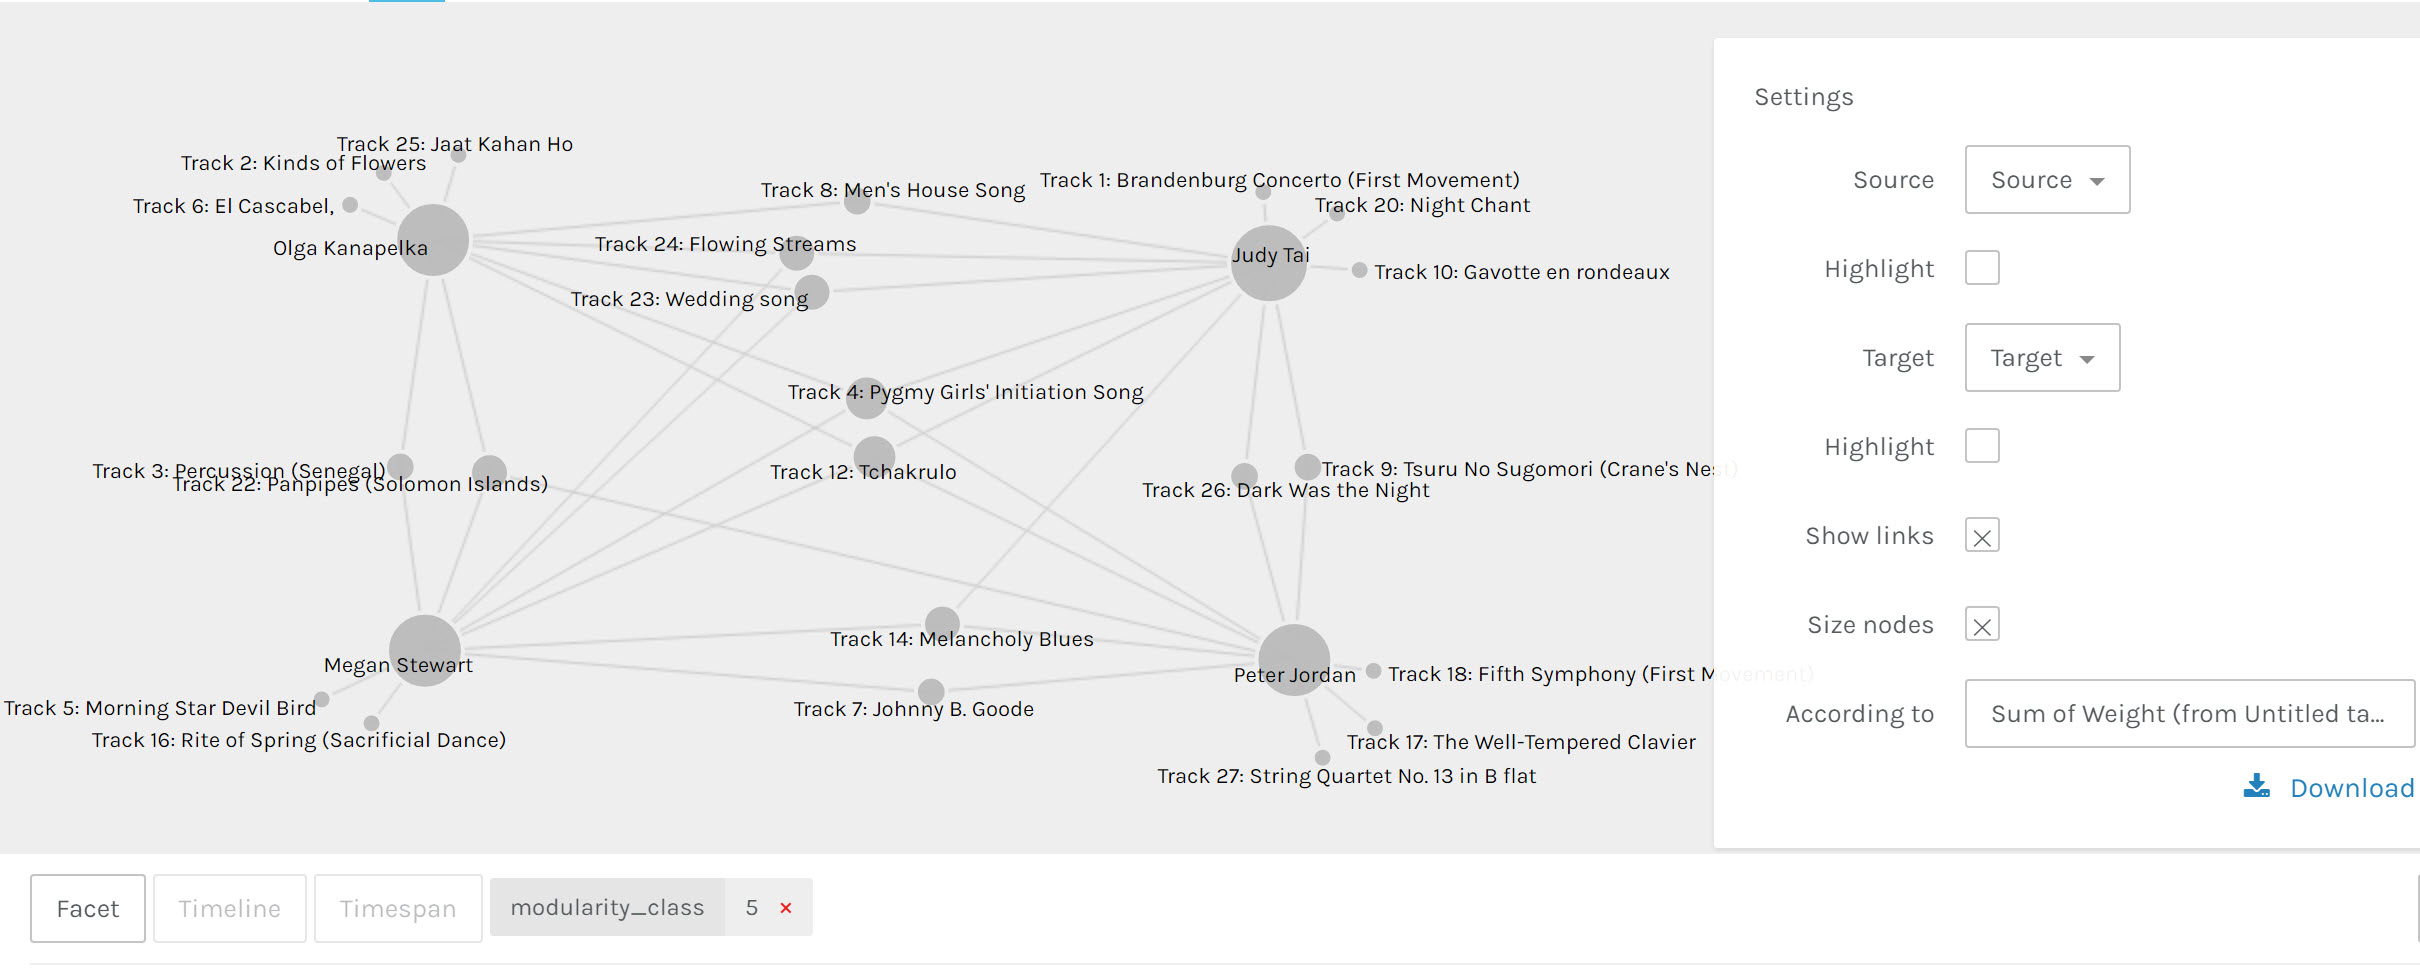
In my group, I was connected with three other students. By moving the edges around, I was able to get a better understanding of our connections. There were two tracks that all of us shared – track 4 (weight of 5) and track 12 (weight of 9). Additionally, I was connected by two songs with Judy and Megan, and one with Peter and Megan. Each of us had 2-3 selections that we did not share with anyone in our group.
Data interpretation
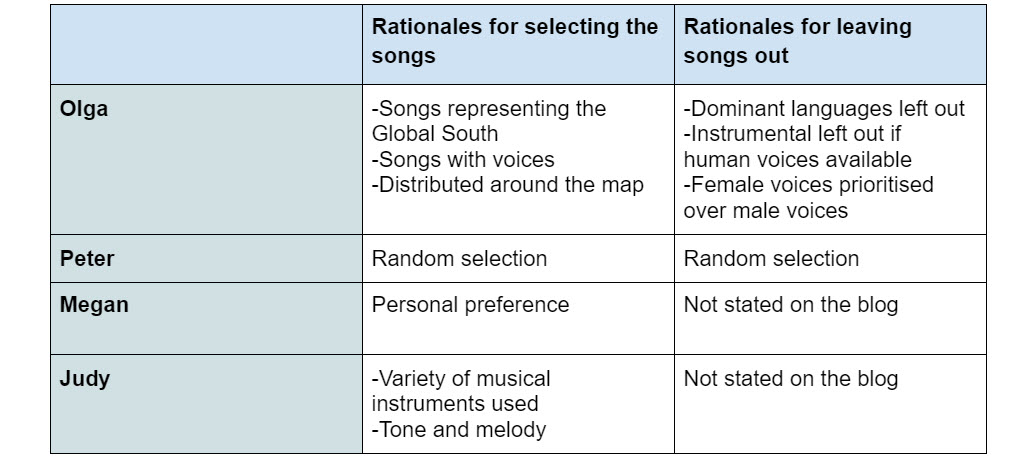
One obvious interpretation that one could make by looking at the graph is that the four of us either have the same taste in music or that we selected songs based on similar criteria. Luckily, we had access to each other’s blog to reveal the selection criteria.
To be honest, I was quite shocked after reading how each of my groupmates selected the songs (I am still gasping and shaking my head in disbelief as I’m typing these words!). I had expected to find at least some of the same criteria, but I found none (Was that the rationale for forming the group, Ernesto?).
Peter left it all to chance, justifying his strategy by bots making choices for us anyways. Interestingly, he was able to build quite a vibrant network of connections with his curated list.
Megan decided to experiment with selecting the list based solely on her personal music taste. She does not specify in her blog which songs she excluded and why.
Judy’s main selection criterion was a variety of musical instruments in the songs. Interestingly, her list contained only 8 songs instead of 10, and she also included the verbal greetings from a different part of the Golden Record. In contrast with my choices, Judy did not take into account the song distribution around the globe – 2 of her tracks are from Peru, 2 are from the US, and 3 are from Europe.
Reflection
I was expecting to find some commonalities among our choices, but what I found was more profound – we were grouped by the diversity of ideas and approaches. If we were to send our mini-collection into space accompanied by the chart above, aliens or the people of the future would learn that humans are very diverse, and approach the same task in a variety of ways.
What does it all mean and why does it matter?
The data visualization tool helps us understand how information is organized on the internet. In the overwhelming amount of data available online, search engines use AI algorithms to predict our needs and to provide information from sources with the highest degree of connectivity (code.org, 2017). While the search engines bias us into selecting the most weighed pages, I wonder if that is what we need. After all, cultures develop and evolve through differences, not sameness.
References:
Code.org. (2017, June 13). The Internet: How Search Works. Retrieved from https://youtu.be/LVV_93mBfSU
Systems Innovation. (2015, April 19). Network Connections. Retrieved from https://youtu.be/2iViaEAytxw