Welcome
These are some of the works and projects I have created using ARCGIS or Adobe Illustrator. The maps were created using tools I have learned in class or with other sources provided in lab sessions. All maps were made with ArcGIS or Adobe Illustrator.
GEOB 270 Final Project Report
Click on link to download and view the report
Geographic Informative Systems Final Project (GEOB 270)
1) What was your team’s project proposal and goal?
Our project was to map “ideal” habitats for mosquitoes in the Squamish Valley and Howe Sound region of British Columbia primarily because of 2 factors: 1) we all love to hike in that area in the summer, 2) Mosquitoes are common throughout BC in the summer and we dislike having mosquitoes ruin our outdoor recreational activities. We wanted to determine which trails or hiking locations were the most prevalent to mosquitoes inhabiting determined areas in the region.
2) How did you organize your team?
Our team was organized on the basis of a simple let’s meet up in the computer labs on campus and just do whatever was needed to acquire data on mosquitoes, simply put we were finding data and sources. After that, it was one person who was on ARCGIS and ARCCatalogue making the GeoDatabase with the files the other team members (team of 3) acquired or were acquiring. But as we progressed we realized not all data was relevant. In the end it was 2 of the team members working on the map directly and 1 person editing and organizing the report, but all team members worked on all parts of the project, but some in more areas than others. A flexible division of labour to simply put it.
3) What are some interesting things you learned as a result of the process?
One of the most interesting and challenging things about the project was finding reliable sources and data on mosquitoes. The data was much more difficult to find since there was a lack of accurate data in Canada, but sources were enough to determine and allow us to know where to find mosquitoes in Canada. Mosquitoes to our surprise were very abundant, hardy, and also pesky insects, some being able to adapt to the swampy marshlands of Northern Canada. However we had to learn to create an “ideal” habitat as there was no mosquito zone data. Instead we read sources and used what mosquitoes preferred to live in (e.g moisture, stagnant freshwater sources, trees with plenty of leaf litter, preferably low elevation, poor drainage, etc…). From there we found layers of environments suited for mosquitoes and slowly edited them and joined them. My team and I found it very stressful as sometimes the data was faulty or the quality and resolution was poor so we had to be flexible. Not only that, but the amount of layers we used prior to joining and during the layer joining process was time consuming and we learned to multitask and handle stress well when ARCGIS would fail to join the layer even after 30 minutes, an adversity we overcame eventually.
Lab 5: Ecologically Sensitive Areas Within a Proposed Ski Resort Site (Garibaldi)

ACCOMPLISHMENT STATEMENT (Lab 5):
Increased understanding of buffers, demarcation, and boundaries in this project. Used various colours that not only had to be pleasing to the eye, but also be clearly distinguished and relevant to the key it represented. Overall this map was the most difficult to create of all because of the attention to detail and also because this project was a cumulation of what we learned put to the test, but in the end I was satisfied with my result and increased in confidence working with ARCGIS.
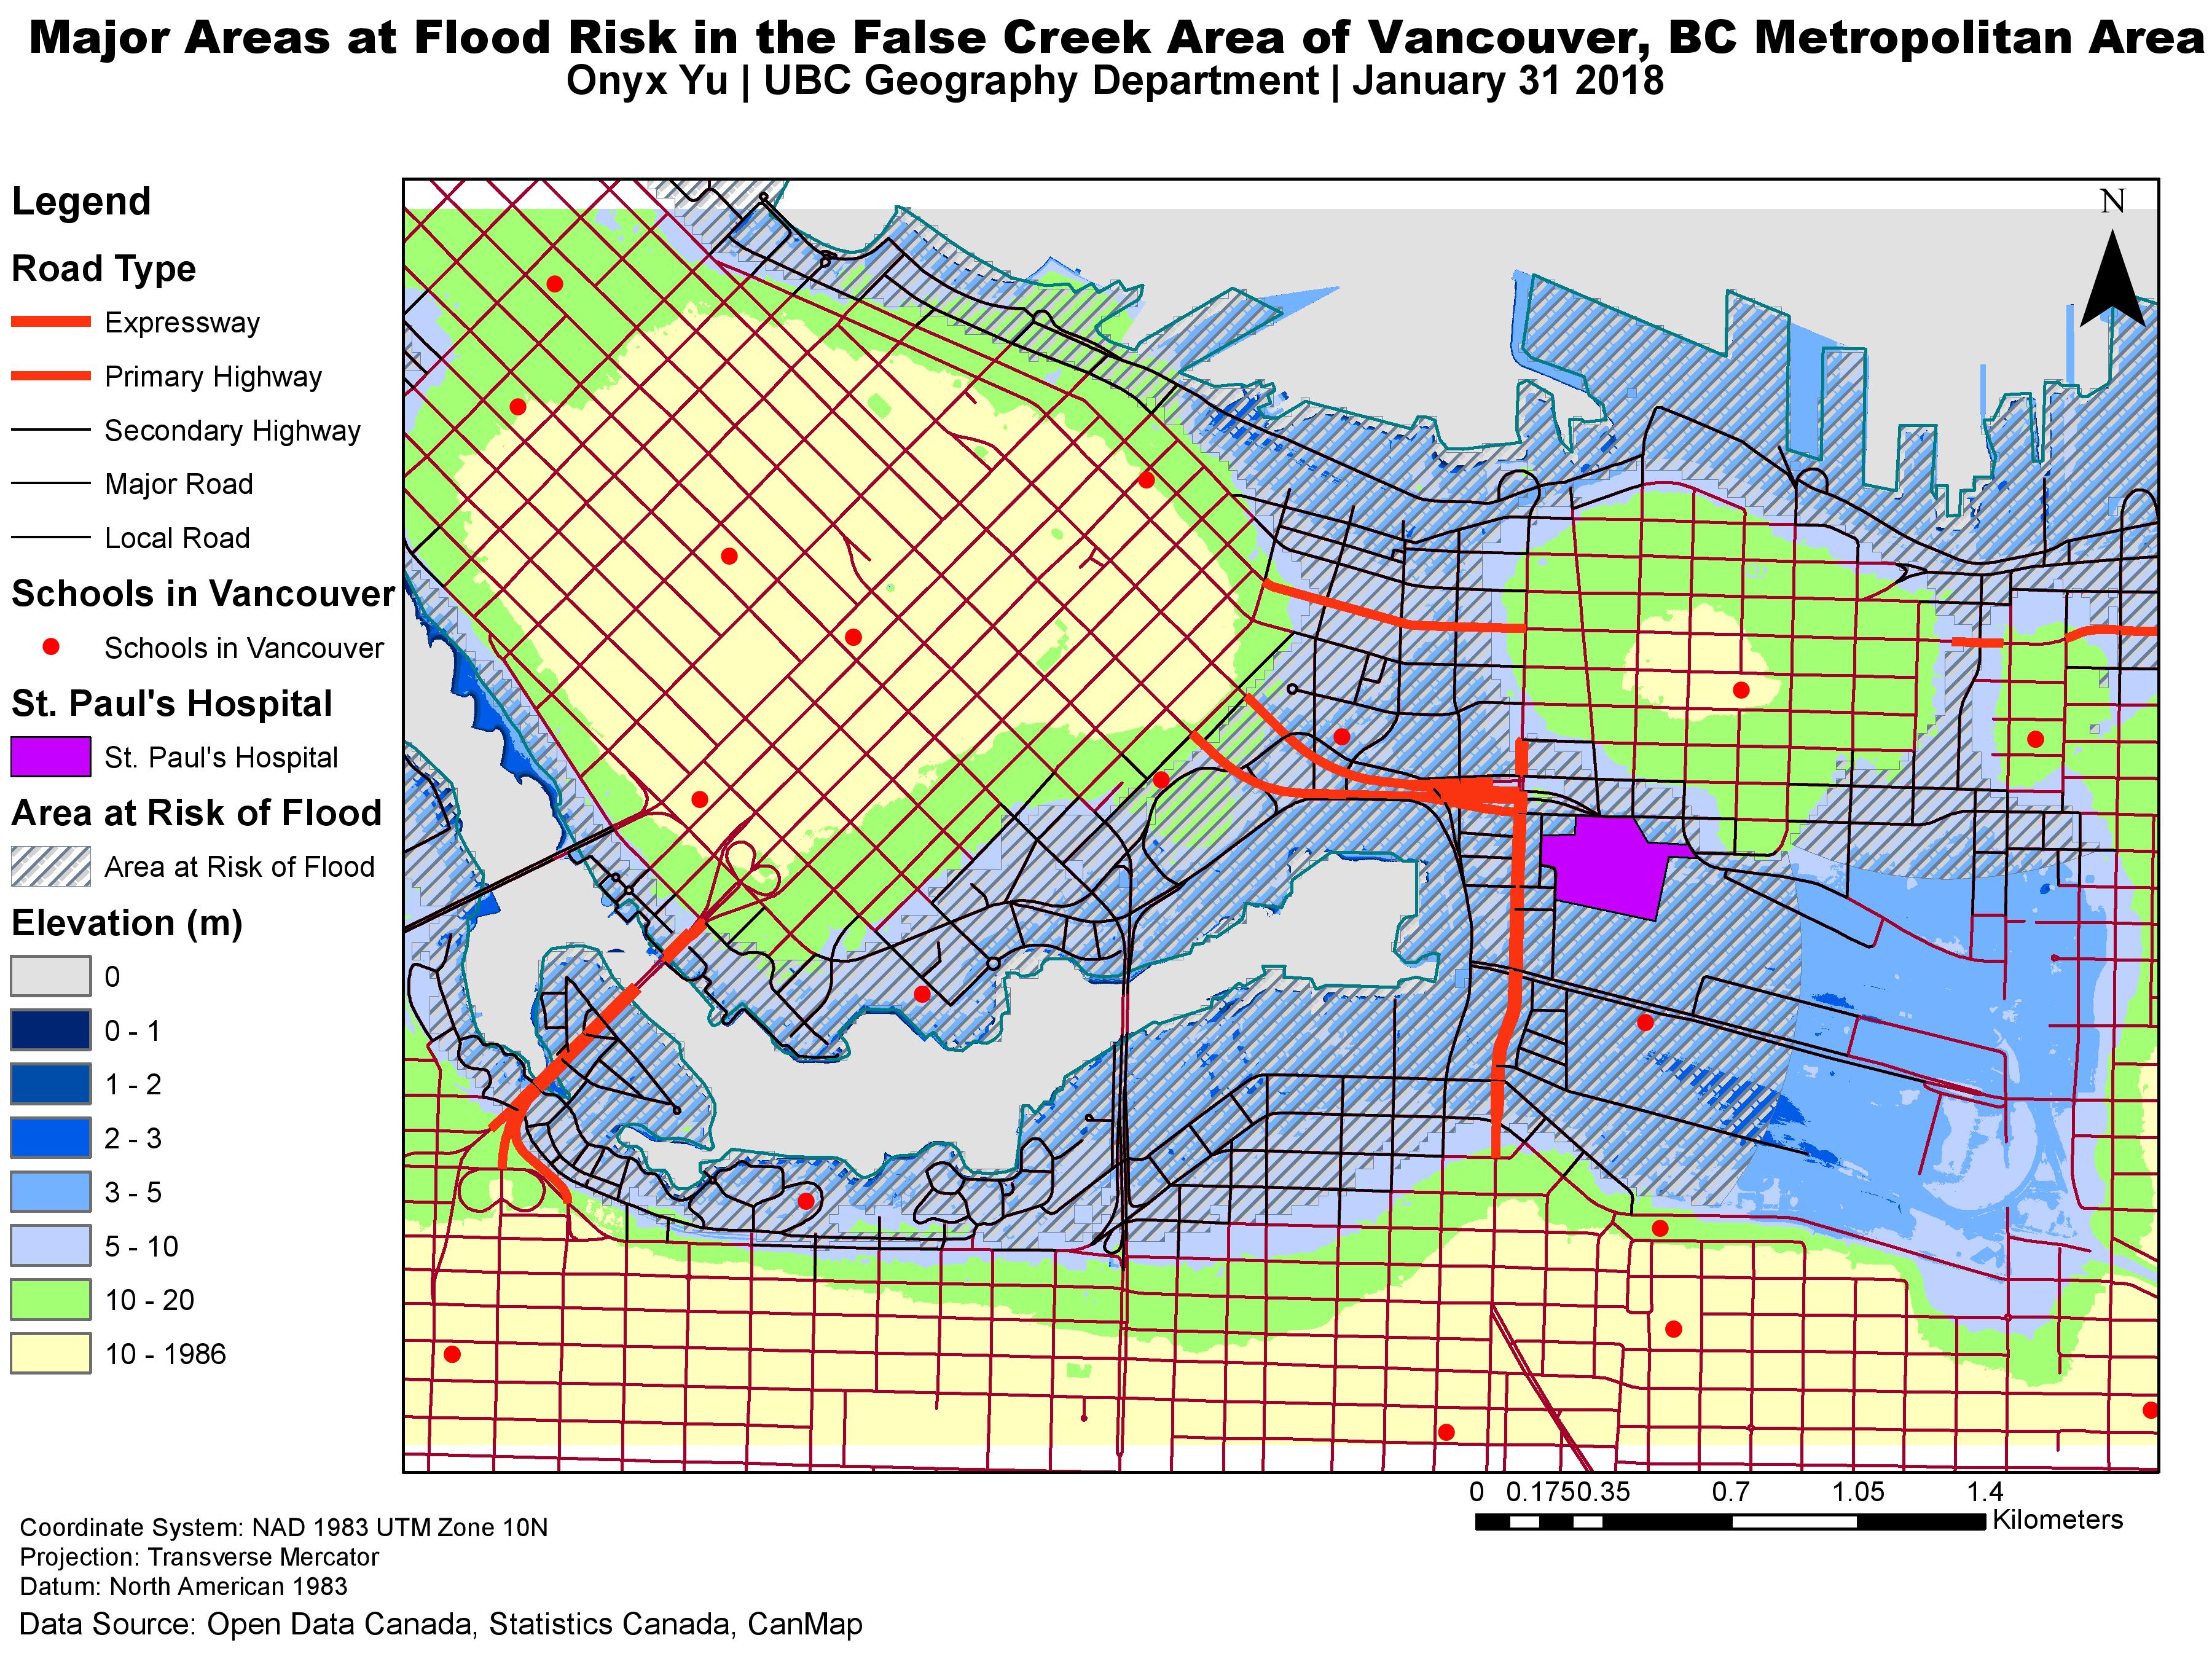
Lab 3 – Storm Surge Risk: False Creek and Downtown Vancouver

ACCOMPLISHMENT STATEMENT (Lab 3):
Gained knowledge and understanding of datasets, particularly natural hazards and in this case the risk of a storm surge in the False Creek and Downtown Vancouver Area. Mapped out particular sites of interests or importance in case of emergency and analyzed which data is relevant in certain emergency situations.
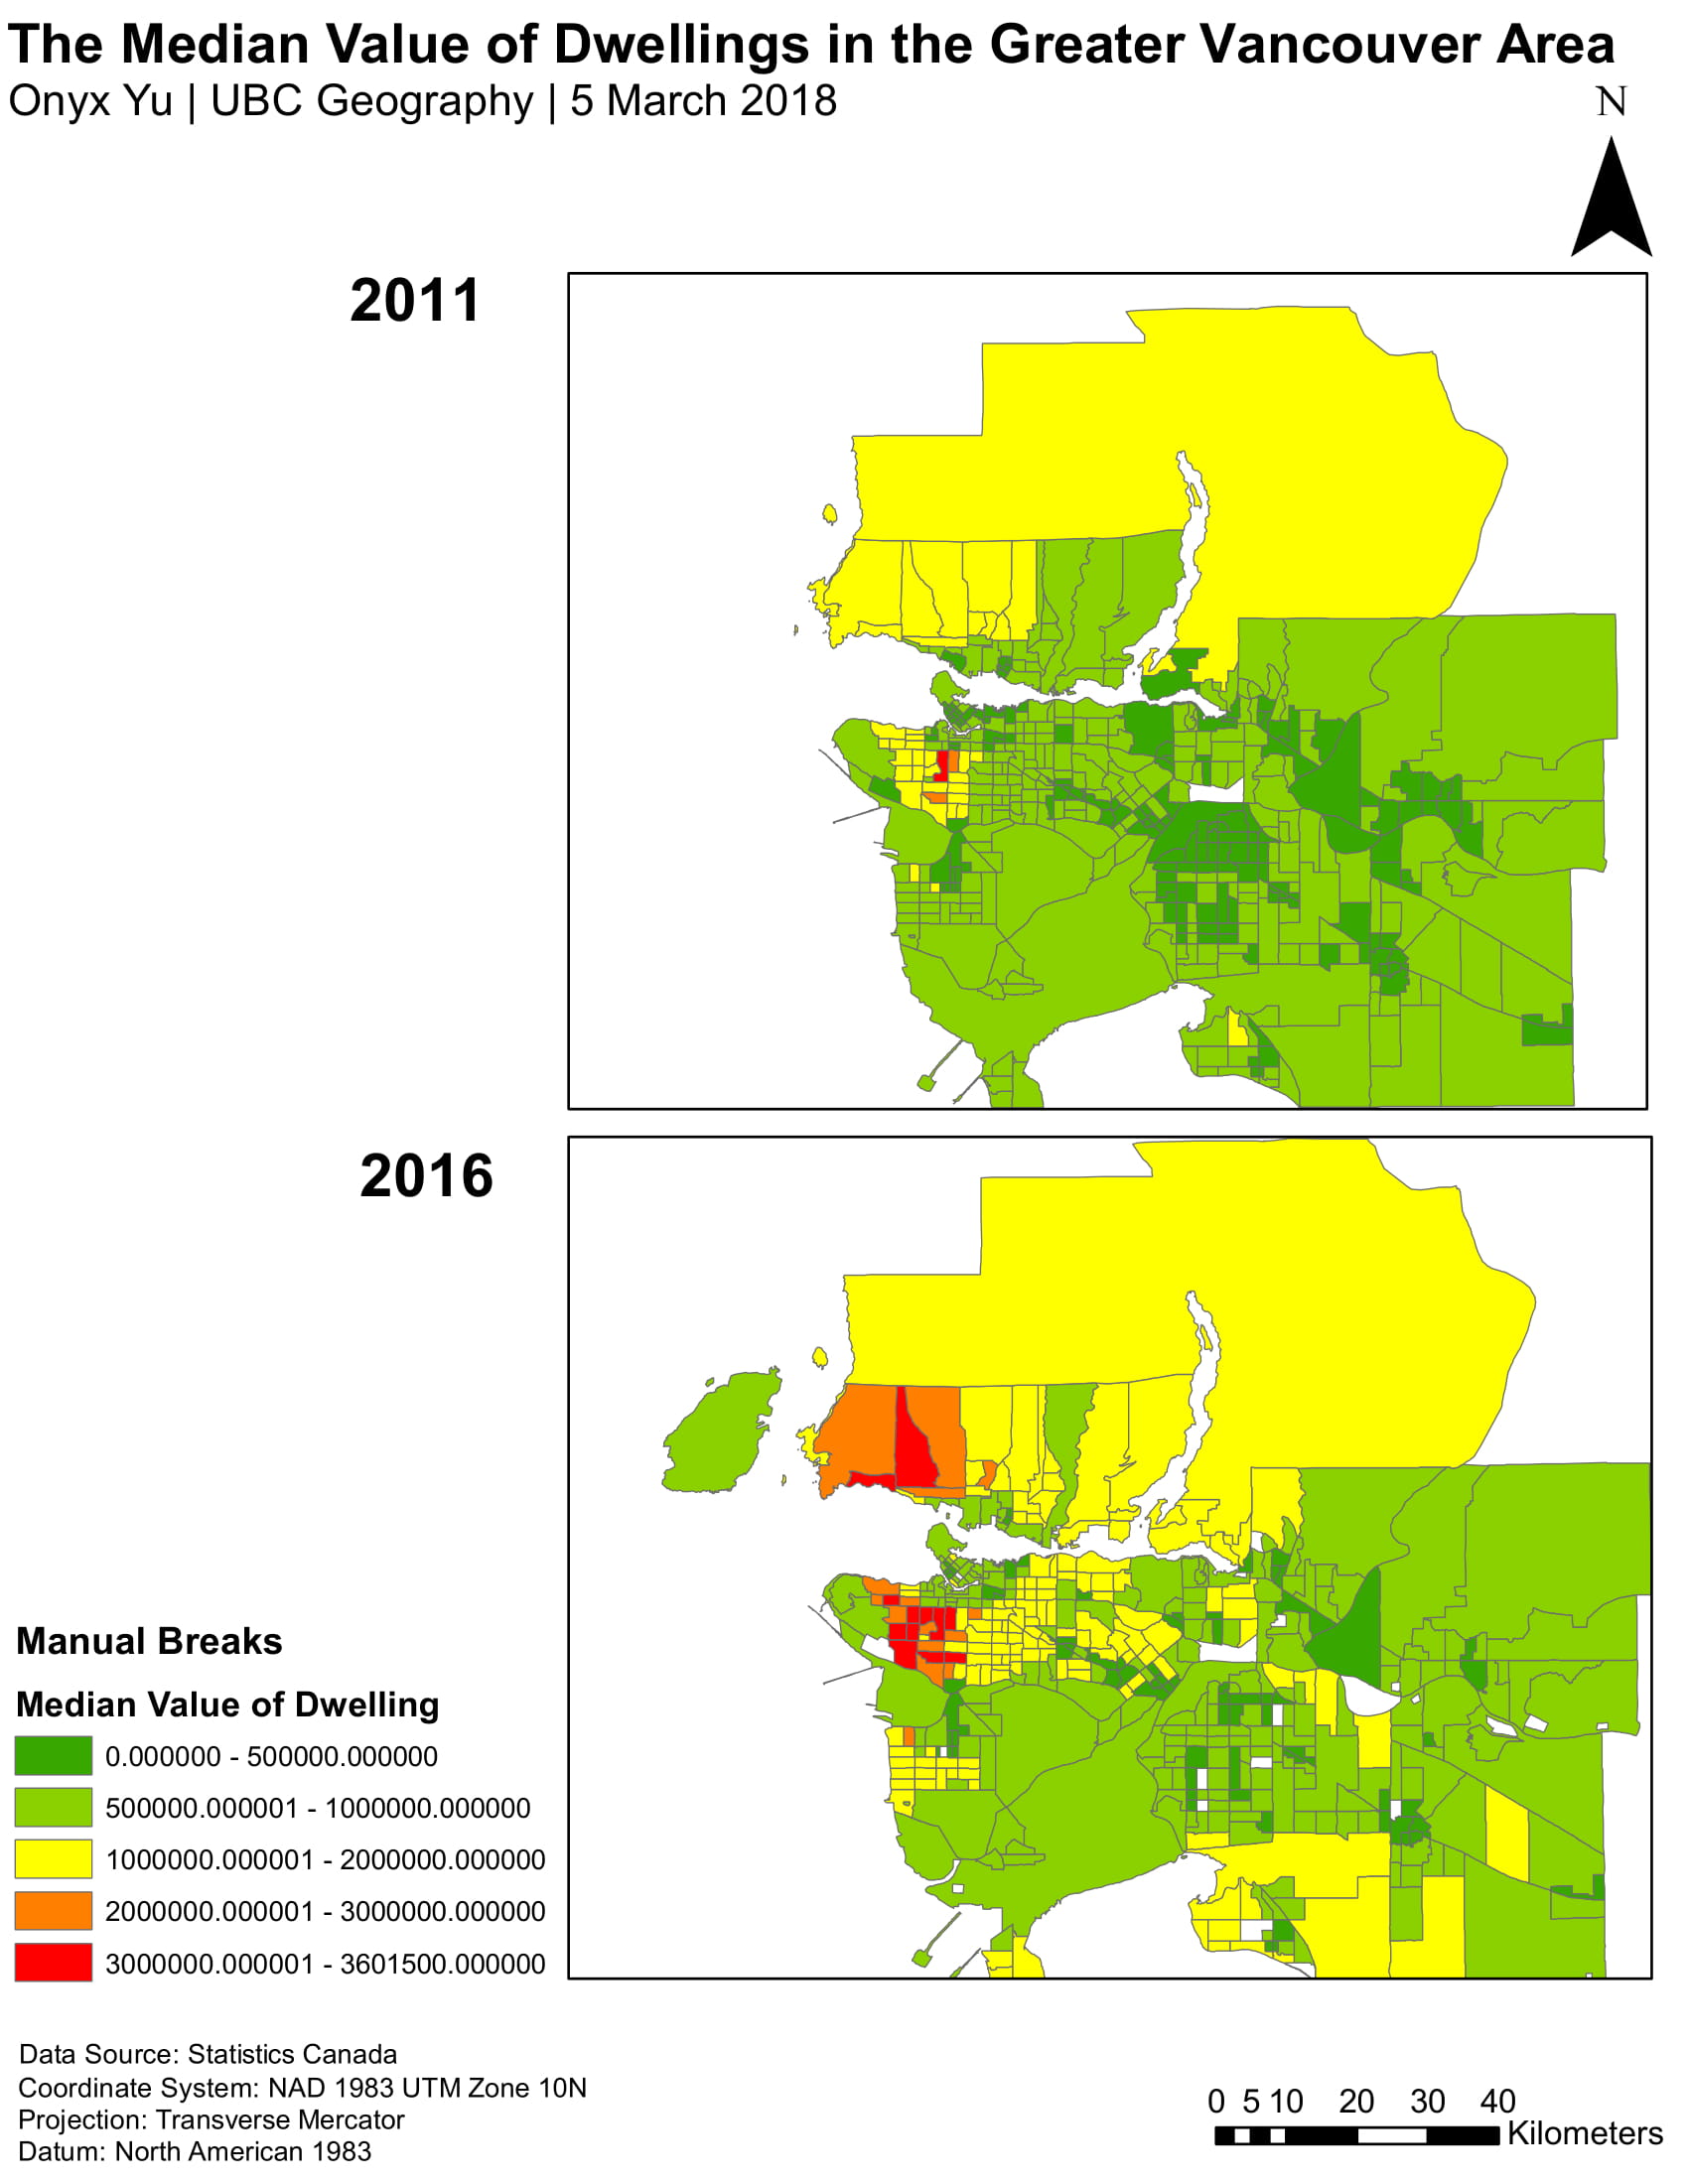
Lab 4: Greater Vancouver Median Dwelling Prices (Comparison: 2011 and 2016)

Median Value of Dwellings in Greater Vancouver
ACCOMPLISHMENT STATEMENT (Lab 4)
Evaluated geospatial data and tabular data sets of housing prices across the Greater Vancouver Area throughout a 5 year span. Analyzed changes in the housing market via GIS technologies and mapped the data and change as shown. I was impressed with this lab due to how clean the final outcome looked and this topic was more of interest and relevance to myself and Vancouverites because of the housing crisis in the Greater Vancouver Area.