The three assignments are a reflection of the core pillars of the course; Landscape Ecology, Health Geography and Crime Analysis. I have seen Kevin around in other geography courses for the past two years. We were formally introduced to each other while doing something for another course just last semester, so once I saw him again in this course I saw an opportunity to work with him for once just to see what can be achieved.
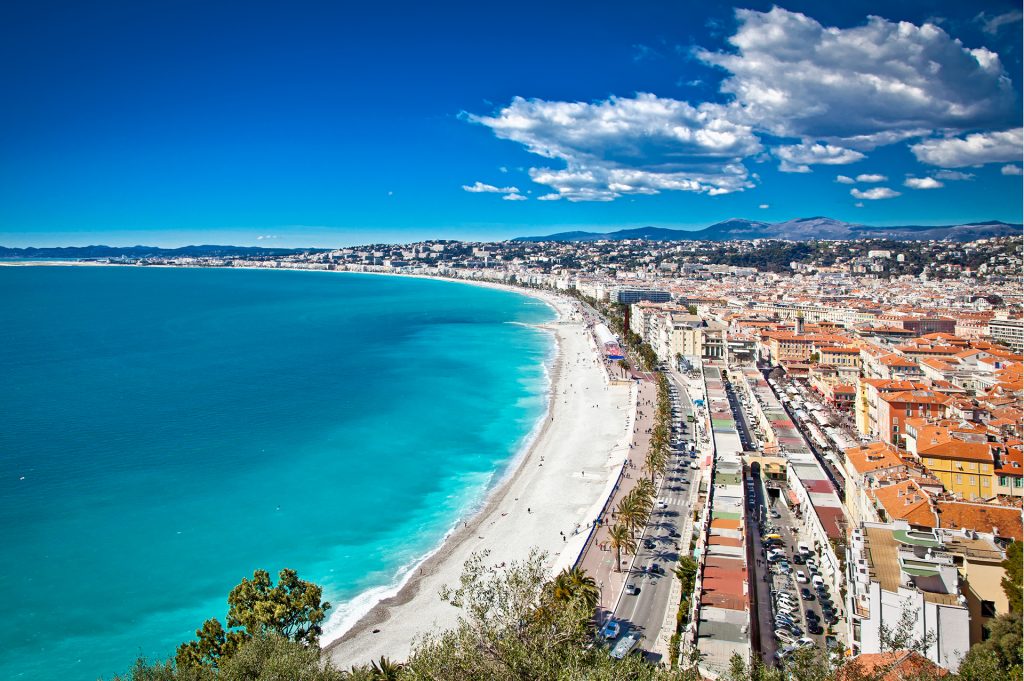
Our first paper on landscape ecology reviewed the forest recovery since 1860 in a Mediterranean region: drivers and implications for land use and land cover spatial distribution. This research investigates Europe’s Mediterranean region and the ongoing trend of forest recovery since 1860. The area of interest is Southern France, comprising mainly within the Provence-Alpes-Cote d’Azur, but extends around the coast to the Pyrenees and also including the island of Corsica. The study areas themselves not necessary around major population centers, but in and around close proximity to them. This is an anomaly to trends normally observed since 1850, which is of a globally-wide pattern of consistent deforestation and encroachment of previously untouched woodlands. The research focused specifically on analyzing land use and land cover as a factor in assessing environmental changes. By using the biophysical and socioeconomic effects, the drivers were correlated to dependent variables such as forest cover, arable land and pastures.
With respect to the region, human activity since the last glacial maximum is computed to have contributed to 50% in land use changes, particularly through the conversion of forest patches and mediterranean woodlands into productive agriculture settings. The forests started to cover through land abandonment and protection. In France and Italy, primary factors involve rural depopulation and improved crop yields, which reduced the need for agricultural expansion. The slope, soil productivity, distance from roads and distance from pre-existing forests all contribute to faster Mediterranean forest recovery. The biophysical features of the Mediterranean has strong and unique constraints, including water limitations during the long, hot and dry summer season. The subsurface is hard calcareous substrate with considerable rockiness which gave rise to the specific types of agriculture found in the region today (vineyards, olive trees, lavender). Early settlers also extensively farmed the landscape, resulting in deep terraced landscapes and extensive grazing on the surface.
The results were derived from the deployed GIS methodologies which is explained below. In application terms, it exhibits a trend which depicts an increase in land cover for both forests and built areas. The former grows over time, gaining land cover from other classifications, mainly from arable land and pastures. Built areas grow with increasing population, albeit the areas around the study sites were all only small villages, with most major population centers relegated away to the coast at Nice, Marseille, Montpellier and Monte-Carlo.
The forest area grew from 516 to 1046 between 1860 and 2010. Conversely, both the arable land and pastures see a decrease. Arable land sees a drop from 971 to 668 over the same 150 year period, and pastures sees a decrease from 372 to 105. These numbers pertain to land use “sites” that the researchers have done themselves, as opposed to being some form of area measurement. In 2010, 74% of the forest cover came from forests originally around in 1860, 12% came from arable land and another 13% came from pastures. Final GAM Models for major land use and land cover types shows a significant importance and influence of the biophysical factors slope and substrate type, with less importance attributed to elevation, sand and rivers. Similar methods for socioeconomic factors yields a conclusion that houses are the biggest influencing factor to forest recovery, with roads and town square centers having less importance.
The research is done with good precision and accuracy, with a reliable back catalogue of historical data as the area has been populated for many millennia, although the authors does not hesitate to warn of the potential limited precision in historical georeferencing and questionable mapping units used in historical data, therefore urging future researches of the area to exercise caution when trusting this data. Overall, Provence-Alpes-Cote d’Azur sees a slow but steady increase in forest cover since 1860s for certain, with the improved agricultural yields leading to the abandonment of constant spread of agriculture and pastures into originally forested land. This was then later aided by the region’s complex topography and (in some areas) fairly inaccessible terrain, effectively making it an insurance policy. Slope, topography, position, substrate type and distance from human settlements does indeed all play a role into this period of forest recovery.
Forest recovery has recently been a more self-sustained process than anything to do with human-induced policies. Indeed, the legitimacy in forest recovery as a measure away from population centers is a confirmation of this fact. Once agriculture modernized, farmers abandoned excess land as they are a hassle for maintenance, and these areas tends to be the most inaccessible areas first, such as those with bad topography. Modern Mediterranean human settlement patterns expands existing population centers, but not of setting up new spaces and invading into untouched territory. The remaining patches of forest in 1860 has since then been allowed to grow back, recovering to the latest 2010 data indicated in the research.
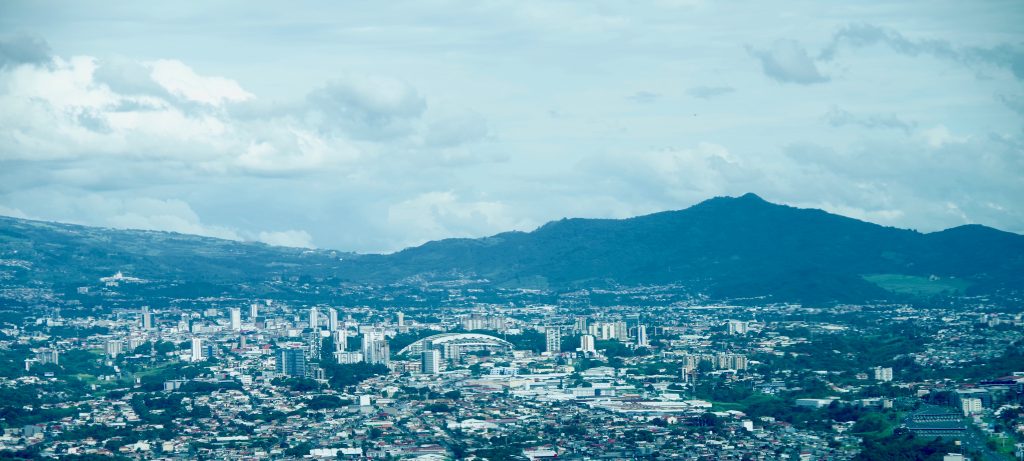
February brought about Health Geography and we unhook a review for Spatial access to health care in Costa Rica and its equity: a GIS-based study. This study assembles a geographic information system to relate the 2000 census population with an inventory of health facilities. The model assumes the census population to be the demand under this specific set of circumstances, with the population making the supply side, being the dependents on spatial access to healthcare. The research assesses the equity in access to health care by Costa Ricans and the impact on it by the ongoing reform of the health sector.
Through the use of traditional measurements of access based on the distance to the closest facility, the research proposed a more comprehensive index of accessibility, results of an aggregation of all facilities weighted by their size, proximity, and characteristics of both the population and the facility. The weighting factors of this index were determined with an econometric analysis of clinic choice in a national household sample. Half of all the Costa-Ricans reside less than 1 km away from a small clinic-level care outlet and 5 km away from a major hospital. Through data collection and use of the index of accessibility, the results suggests that in equity terms, 12 – 14% of population are underserved according to three indicators: having an outpatient outlet within 4km, a hospital within 25 km, and less than 0.2 MD yearly hours per person.
There is evidence to suggest of substantial improvements in access and equity to outpatient care between 1994 and 2000. These improvements are linked to the health sector reform implemented since 1995, which it’s more comprehensive set of regulations was not reiterated by the research per se, but a simple search of the original document yields all the necessary information. Like any authoritarian state, all manners of institutions of the country naturally falls to the state. This is the case with Costa Rica’s health sector. A single public institution monopolizes health insurance and provides most of the curative and preventative services available within its borders. The 1990s was significant in the way of pushing for privatization and decentralization of control over healthcare agencies, despite there being stiff opposition by the state.
The share of the population whose access to outpatient health care (density indicator) was inequitable declined from 30% to 22% in pioneering areas where reform began in 1995–96. By contrast, in areas where reform has not occurred by 2001, the proportion underserved has slightly increased from 7% to 9%. Similar results come from a simpler index based on the distance to the nearest facility. Significantly, access to healthcare has not improved in any way during the decade of the reform, leaving the facilities stagnant and without reach to more of the population in need of them. The GIS platform developed for this study allows pinpointing communities with inadequate access to health care, where interventions to improve access would have the greatest impact.
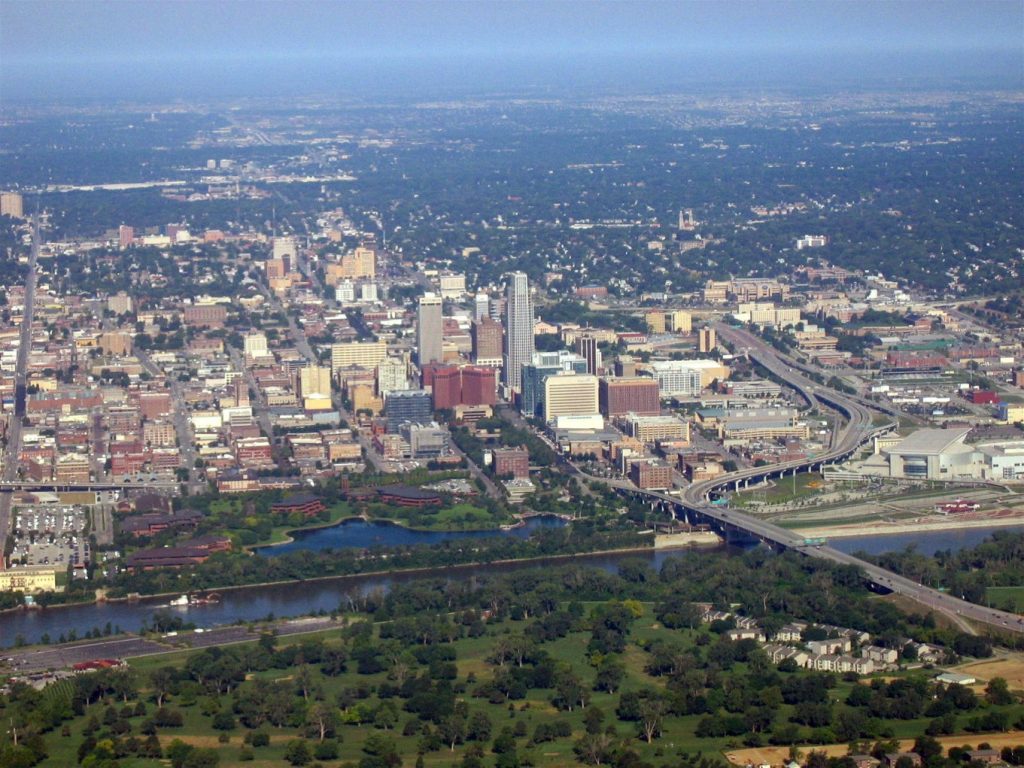
For crime analysis, Kevin and I did a review for A Spatial Analysis of Neighborhood Crime in Omaha, Nebraska Using Alternative Measures of Crime Rates by Haifeng Zhang & Michael P. Peterson. This paper focused on the comparison between three types of measures of crime rates. The three types are: 1. The official measurement of the frequency of crime (official crime rate) defined as the number of incidents of each type of crime committed in an area (e.g., a neighborhood/city/nation…) standardized by the area’s population; 2. Location quotients of crimes (LQCs) which is a ratio between number of incidents of each type of crime in a small area (e.g., a neighborhood) and the total count of each type of crime in a larger reference area (e.g., a city); 3. Crime density – the number of incidents of each type of crime per unit area (e.g., km2) in a given area.
A literature review was conducted by the author, and the major critique found against the official crime rate is the meaninglessness of standardizing by population, because neither criminals nor victims in many cases were from the same neighborhood where the crimes were committed. This is especially common in commercial and tourist zones. In residential areas dominated by apartment complexes, the official crime rate tends to underestimate the risk of crimes as the intensity of crime is diluted by the large population in these areas. On the other hand, LQCs and crime density are not population biased, and the author believes they are superior than the official crime rate in measuring the risk of crimes.
To further compared the differences between LQCs and crime density, hot spot maps for assault, robbery, auto theft and burglary crimes in the city of Omaha, Nebraska were produce. With examples on the map, the author demonstrated the major flaw of LQCs that the LQCs values could be either inflated or deflated for neighborhoods with extraordinary low or high frequencies of crimes. In addition, the study compared the explanatory power of different Ordinary Least Square regression models (for crimes in Omaha, Nebraska) using the three different types of crime rate measures as dependent variable, respectively. The result indicates that the crime density model had the highest R2 value (0.80), while the LQCs model had the least (0.201). Therefore, the author suggests that crime density is the most effective measure among the three.
Abadie, J., Juliet Abadie, Jean-Luc Dupouey, Catherine Avon, & Xavier Rochel. (12/01/2017). Landscape ecology: Forest recovery since 1860 in a mediterranean region: Drivers and implications for land use and land cover spatial distribution Springer.10.1007/s10980-017-0601-0
Eitzel, M. V., Eitzel, M. V., Kelly, M., Dronova, I., & Valachovic, Y. (01/01/2016). Ecological informatics: Challenges and opportunities in synthesizing historical geospatial data using statistical models Elsevier.10.1016/j.ecoinf.2015.11.011
Rosero-Bixby, L. (2004). Spatial access to health care in Costa Rica and its equity: a GIS-based study. Social Science & Medicine , 58 (7), 1271-1284. http://dx.doi.org/10.1016/s0277-9536(03)00322-8