
What is PM?
- PM10 is particulate matter 10 micrometers or less in diameter;
- PM2.5 is particulate matter 2.5 micrometers or less in diameter;
- Ultrafine particles are particulate matter of nanoscale size (less than 100 nanometres in diameter);
PM2.5 is generally regarded as fine particles. PM10 is regarded as coarse particles. Both are largely associated with the potential damaging effects they can have on the human body.
Significance of Issue
Particulate matters (PM) are air pollutants commonly associated with adverse health effects (Vedal, 2003). The health effects include:
- toxic effects by absorption of the toxic material into the blood (e.g. lead, cadmium, zinc)
- allergic or hypersensitivity effects (e.g. some woods, flour grains, chemicals)
- bacterial and fungal infections (from live organisms)
- fibrosis (e.g. asbestos, quartz)
- cancer (e.g. asbestos, chromates)
- irritation of mucous membranes (e.g. acid and alkalis)
- increased respiratory symptoms, aggravation of asthma and premature death. The risks are highest for sensitive groups such as the elderly and children. (Technical Advisory Panel. , 2006).
PM10 in cities originates mainly from a variety of anthropogenic sources including industrial point sources, motor vehicles, construction and road dusts etc. (McKendry, 2005a). Therefore, exposure of PM is usually higher and is associated with bigger health risks in urban and industrial areas due to the increase in the number of sources.
Cycling is often seen as a form exercise that promotes physical health. However, if constantly riding on bike routes that are on road right-of-way or frequently pass through construction sites, cyclists’ exposure to PM can be high, and even exceeds WHO’s recommended limits of exposure (Panis, L et al, 2010). It is worthy to look at the estimated concentration specifically along the bikeways to address the question of whether cyclists in a city at a given time is breathing clean air.
Rationale
PM10 is chosen as the subject of the study because of they often have a bigger spatial variation of distribution.
PM 2.5 is generally a more dominant air pollutant and has generated more research interest and concerns. It’s associated with higher air quality index which indicates it as a more threatening pollutants than PM10. For instance, 15.5 mg/m3 of PM2.5 corresponds to an AQI of 50, while it takes 55 mg/m3 of PM10 to reach the same AQI number.
However, according to Amy Thai’s paper, PM2.5 distribution is relatively homogeneous through out the study routes (which is confirmed by other studies) (2008). The distribution is due to fine particles having a long atmospheric residence time, as they can remain airborne for extended period, they disperse well like gas (Amy Thai, 2008). In contrast, PM10 shows a more heterogeneous pattern, and is resulted from coarse particles’ short gravitational settling time (Amy Thai, 2008). PM10 concentrated closer to their sources, and the peaks measurements data from Thai can be more effectively used to determine relative influence of sources in the spatial analysis.
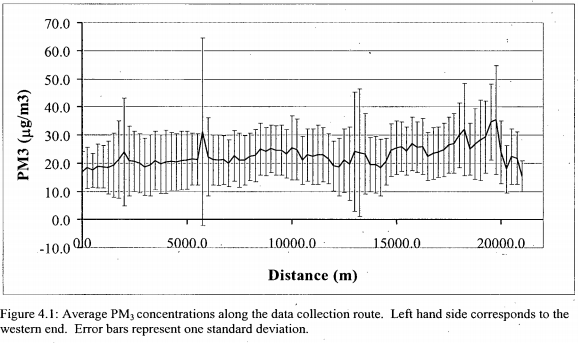
Comparative view: PM 2.5 concentration distribution – homogeneous
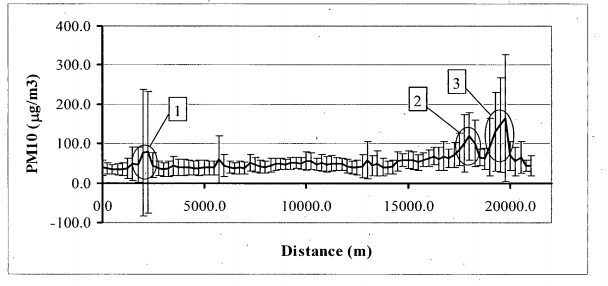
Comparative view: PM10 concentration distribution – heterogeneous
Goal
For the most cities with pollution from transport and other combustion sources, an associated non-combustion source is dust re-suspension (from road dust and dust storms). Coarser fraction (PM2.5 to PM10) are often generated through the re-suspension process. High concentrations of PM10 in urbanized transit environment can be linked with harmful health issues – especially respiratory and cardiovascular diseases (Reid, 2015). s Since there are fair portion of bikeway routes located near major roads / construction sites in Vancouver, it’s worthwhile to look at PM10 exposure along the bikeway to understand the health implications associated with it.
Since:
- Long-term tower measurement usually reflects an averaged background value at a city-wide scope, rather than along specific routes across the cities.
- The measurements in Thai’s study was obtained ~8 years ago and only contains 20km (a small section) of bikeways in Vancouver.
- lack of other route-specific measurement studies that examine concentration value along bikeways
A gap of knowledge can be found on the current dynamic changing level of exposure along bikeways. The goal of this project is to use Thai’s empirical measurements combined with up-to-date spatial data to give an realistic estimation on the level of exposure of Pm10 along the entire bikeways in Vancouver.
The result of this study can generate reference on the pattern & overall level of exposure in the city. The result can be used to examine whether cycling is rightfully promoted as a healthy alternative to other commuting measures. Areas of concern that might not be aligned with this perspective can also be identified. It can inform cyclists of potential health threats associated with prolonged exposure along routes of high concentration, and its implication can be used to advise on the “best routes” that can be taken to avoid the adverse impacts and get more fresh air!