
Data Acquisition
In a previous study conducted by a MSc student (Amy Thai) in Geography in UBC, an instrumented bike was used to measure PM concentration levels along a determined cycling route in Vancouver. According to the results and analysis of Thai’s study, recorded spatial variation of PM10 concentration is primarily associated with the following factors:
- Land use categories (area sources)
- Proximity to traffic (mobile sources)
- Construction sites (“point sources”)
In this project, these factors were taken as perimeters that would influence PM concentration / exposure along bike routes in Vancouver. The following spatial data was then obtained to represent these variables:
- Vancouver land use categories as according to metro Vancouver standard
- [source: Metro Vancouver Open Data Catalogue – http://www.metrovancouver.org/data]
- Road type and intersections
- [source: DMTI BC Road Data & Vancouver Data Catalogue – http://data.vancouver.ca/datacatalogue/cityStreets.htm]
- Current construction sites
- [source: Vancouver Data Catalogue – http://data.vancouver.ca/datacatalogue/roadAhead.htm]
- Vancouver city’s dedicated bikeways (subject)
- [source: Vancouver Data Catalogue – http://data.vancouver.ca/datacatalogue/bikeways.htm]
Attribute Data Construction Methodologies
The main part of data processing in this project is to extract, extrapolate and assign proper PM concentration values to the spatial factors, so that their relatively influence are accurately represented through the spatial analysis process.
Thai’s study contains several distinct PM concentration values in measurement peaks (with source specified), as well as averaged values for each land use categories. Thus, concentration values are extrapolated for traffic and construction site sources, and are directly assigned to various land use types.
The emission from traffic and construction sites diminishes as moving away from source. A proper spatial extent of the impact of these sources need to be determined – this is estimated based on literature reviews of several studies.
-=-=-=-Concentration value of Land Use Categories-=-=-=
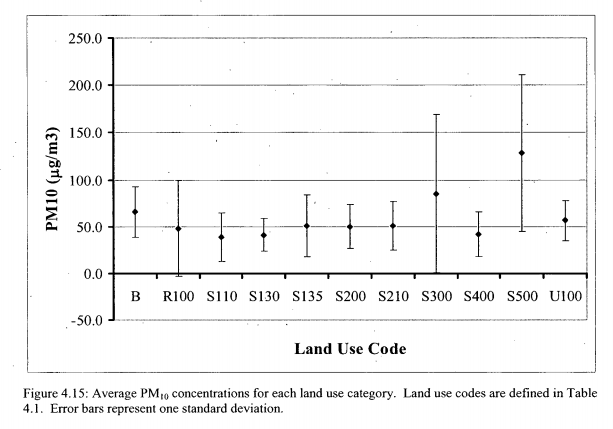
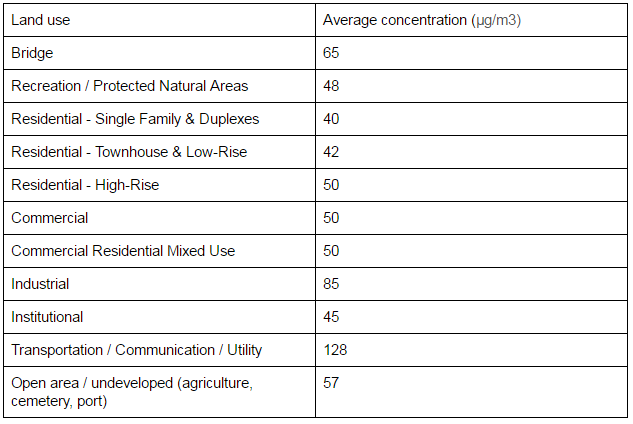
PM 10 concentration for different land use categories are directly derived based on Thai’s averaged measurements, as illustrated by two figures in her thesis,:
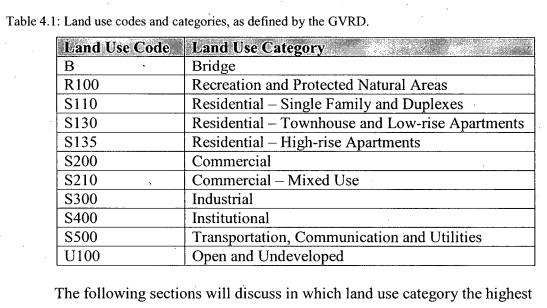
(land use codes
(concentration value for each type of land use
The land use category data obtained from GVRD doesn’t fully agree with land use categories summarized in the study. Therefore, land use type data was parsed into the 10 land use categories established in the study to ensure uniformity of value assignment.
Land use category definition:
- Agriculture + cemetery + undeveloped and unclassified + port Vancouver→ open / undeveloped / unclassified
- Residential commercial mixed use high-rise + low rise → Residential commercial mixed use
- Recreation, Open Space and Protected Natural Areas → Recreation / Protected Natural Areas
- Residential – Low-rise Apartment + Residential – Townhouse→ Residential – Townhouse & Low-Rise
- Residential – Institutional and Non-Market Housing + Residential – Single Detached & Duplex-> Residential → Residential – Single Family & Duplexes (dominating landuse type)
- Road right of ways were deleted
The ones remained unchanged:
- Commercial
- Industrial remains
- Institutional
- Transportation / Communication / Utility
- Residential – High-Rise
Concentration values for each land use categories were then assigned as the following:
-=-=-=-Concentration value of Traffic & Construction Sources-=-=-=-
Land use values are assigned based on the averaged measurements, while values for traffic and constriction sites are assigned as the deviation from the mean measurements in order for the data to be incremental and can be easily summed during analysis.
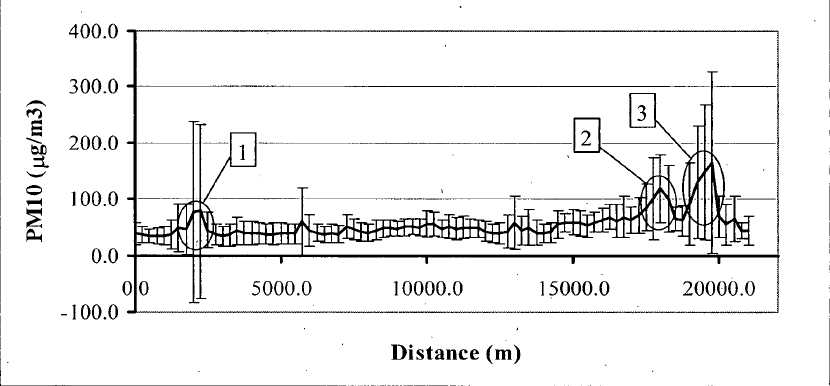
Traffic and construction site induced peak measurement are illustrated in the following graph:
 (Thai, 2008)
Overall mean of PM10 measurements in the study: 53.9 µg/m^3
— peak 1 is associated with a bus passing very close to the bike, likely stirring up road dust and increased the measurement. The impact caused by approximation to traffic source is then estimated as 80 µg/m^3 – 53.9 µg/m^3= 26.1 µg/m^3.
— peak 2 and 3 are attributed to bike passing by construction sites. The impact is determined as the following:
- construction site peak 1: 110
- construction site peak 2: 160
- Construction average: 135
- Overall average of measurement: 53.9
- Construction caused variation: 81.1 µg/m^3
Spatial extent of impact are determined based on several following sources
- in the study, each measurement interval = 5000 m / 20 = 250 m
Impact of construction site induced peak diminishes within 2-3 interval ==> 500 m impact zone - traffic induced peak declines faster and diminishes within 1-2 interval.
- literature suggests:“On average, PM concentration is significantly higher within 330 feet (100 meters) of major highways than it is further away. (Zhu, et al., 2002)”“Pregnant women who live within 500 feet of high traffic areas are prone to birth complications, including premature birth, low birth weight children, and children with medical problems. (Wilhelm & Ritz, 2003) A review of a broad range of studies has correlated early mortality — from a wide range of illnesses — with living within 330 feet of a high traffic roadway and related exposure to various auto emission substances. (Beelen, et al., 2008)”Analyses suggest that the spatial extent of the traffic proximity effects is on the order of 100–500 m, depending upon the specific pollutant (Zhou and Levy, 2007).“PMs from auto emissions are elevated within 1,000 feet (300 meters) of a major highway. (Yifang, et al., 2002, pp. 1038-1039) A Denver study indicated that children living roughly within that distance were eight times as likely to develop leukemia and six times as vulnerable to all types of cancer. (Hulsey, et al., 2004,- par. 1)”These research basically agrees with the observation that impact of traffic diminish rather quickly within one interval of measurement. And consider that PM10 is a coarse PM that has a shorter travelling distance, an 250 m impact zone for traffic sources is used.