
********************************************************************
SIde note: Comparison of Concentration Surface
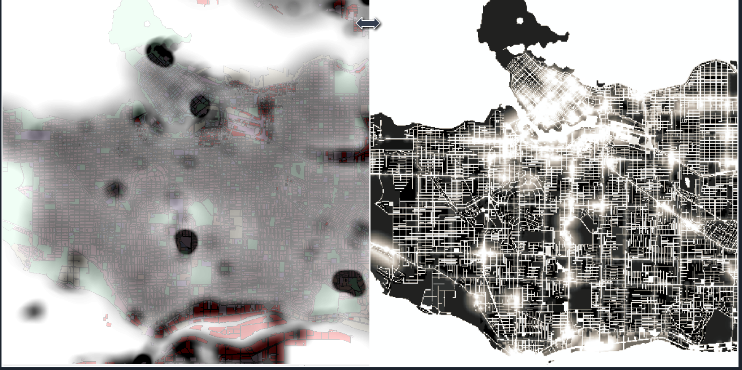
(*city concentration surface generated compared with land use regression model of PM developed by researchers at SPPH, some rough agreement of patterns can be found?*) (Henderson, S. B., Beckerman, B., Jerrett, M., & Brauer, M.,2007))
*************************************************************************
Discerning Patterns / Implications
With regard to PM10, Canada doesn’t have a nation-wide standard for exposure level; BC’s standard is according with WHO’s standard: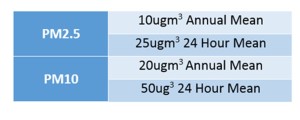
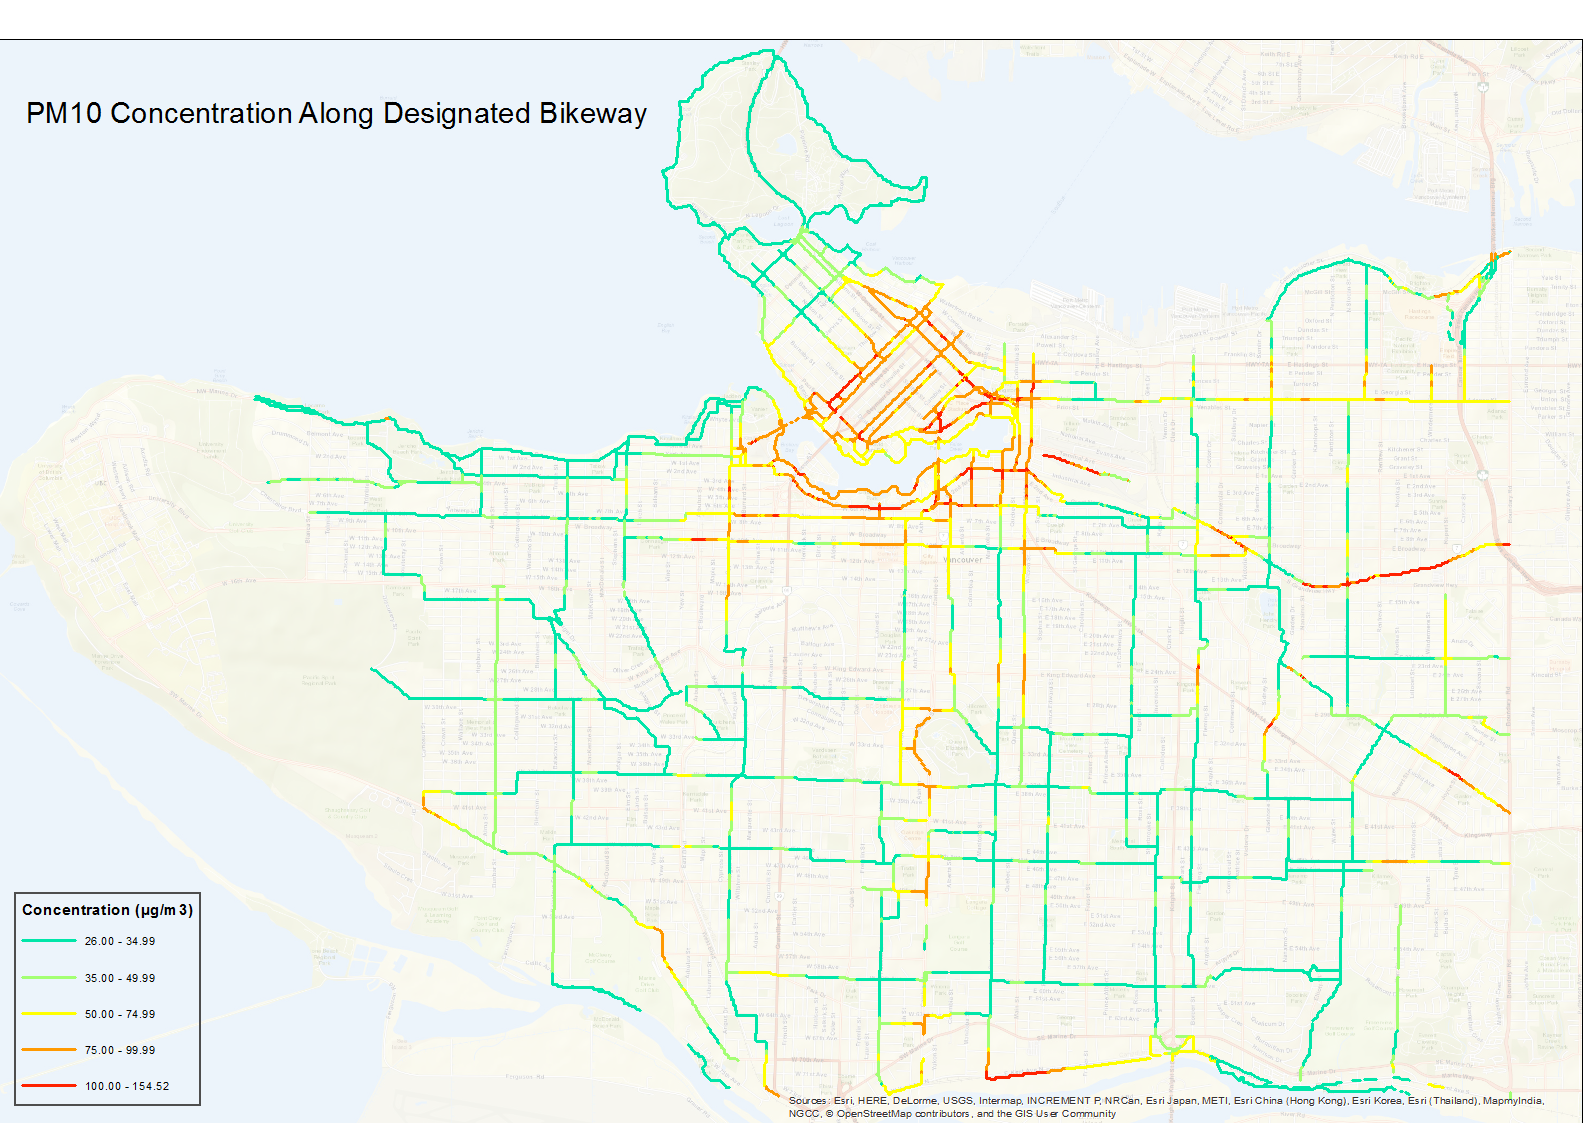
It can be seen from the Pm10 extrapolation results that most sections of bike routes in Vancouver are below the recommended limit (50 µg/m^3). Also, considering that the standard is for a 24-hour averaging time, while the averaging time in this study is over a 1.5-hour, it can be concluded that cycling on most designated routes in Vancouver is prone to rather low level of exposure, and it can be considered as a rather healthy physical activity / commuting measure.
While it can also be observed that areas of exceedingly high levels of exposure (>100 µg/m^3) are concentrated in Downtown and False Creek region. The pattern in downtown can be attributed to a dense distribution of intersections and construction sites in the area. The pattern in False Creek can be attributed to the numerous construction sites and areas of industrial land-use found in the region. Other routes of patchy high concentration are found along Cambie st., Grandview Highway and East Kent Ave N, primary factors are construction sites, and industrial land use.
The patterns in this study is constructed based on both empirical measurement and up-to-date information on the location of construction sites. Thus it provides a current assessment of the Pm10 concentration level, and broaden the implication of findings in previous studies. The figures extrapolated in this study give quantitative references to the level of exposures cyclists would experience along bikeways:
Compared to the background measurements made by Kitslano monitoring station, most parts of cycling routes has a concentration of Pm10 slightly more than the background level, which indicates cycling in Vancouver as a healthy physical activity. The areas with moderately higher concentration can be attribute to cyclists’ approximation to traffic and passing by construction sites. If not remaining in these area for too long (>24h), there are still relatively little health threats associated with cycling in these area. 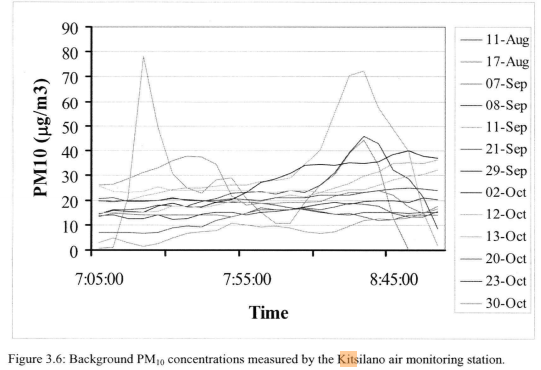 (Thai, 2008)
Limitation of studies / sources of error
1. The construction sites data of varying reliability
Two factors of construction sites data may limit the accuracy of estimation:
- Construction sites obtained from Vancouver Open Data only consists of construction activities on the road.
- Construction sites of various nature are included in the data. Not all construction activities necessarily stir up road dusts and emit construction coarse PM (eg. Condo development vs. Sewer maintenance vs. Mural Festival?)
Thus it can be said that the quantitative estimations may not be highly reliable due to the variation / absent / misrepresentation of construction sites data. While the qualitative patterns still make sense in terms of that areas with a cluster of construction activities would have a higher concentration level which would raise health concerns. Due to the temporary existence of construction activities, the “seasonal variation” caused by them might be reflected by some models / long-term measurements, thus it’s still useful to incorporate these main sources of coarse PM into consideration.
2. The representation of traffic related emission using intersection
As mentioned in data processing section, it’s a simplification method that would most definitely generates some errors – it can be seen in the map that routes with low concentration level can have a small “jump” of concentration at intersections:
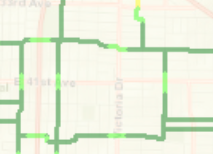
This can potentially reflect that traffic being side-by-side with cyclists at intersections can increase exposure to PM, while it can also be a false pattern generated by simplified measures.
3. The omitted relation between concentration and exposure
This study essentially estimate the level of “concentration” as opposed to “exposure”. Though these two figures should be tightly linked, exposure also take human respiratory factors (breathing rates, tidal volume…) into consideration (Berghmans, P., et al, 2009). Such factors are sometimes included in measurement studies, but not in land use models, and are not incorporated into this study.
4.Inherent Limitation of Data
The measurements in Thai’s study was obtained during autumn seasons in morning rush hours. Therefore, since the quantitative analysis is purely based on that one study, it inherits its temporal features/ constraints. It can be argued that the map is better understood qualitatively (e.g. to look at where would you be exposed to higher level of concentration compared to other regions, overall generalized implication on health impacts compared to WHO standards etc.)