URATION
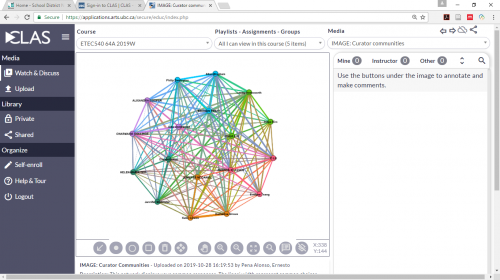
Looking at the Golden Record Curation data, it was interesting to view the multiple node connectivity that were evident in the graph. Analyzing the data, it was clear that there are 6 main node connectivity networks. Brogan, David, Amanda, Jennifer, Elizabeth and Julia were the 6 main networks. These networks had a high degree connectivity with at least two other node networks that are on the other edge of the graph. These 6 main networks are linked by one or more degree of connectivity, which for our purposes was like minded songs. We do know that these 6 main networks had at least two other individual nodes that shared like minded songs that increased the degree of connectivity.
This shows that networks rely on individual nodes to push similar like-minded items to increase the interactions of the main networks. For our purposes, we see that the main networks were reliant on having more songs in common with other individual nodes. This is important because these main networks will receive more interactions than the individual nodes on the outer area of the graph.
It also shows through the walks that the majority of individuals were connected to multiple networks. However, the strength of that connection varied amongst individuals. For some individuals, you had more songs in common which strengthened the connection to the main network. When looking at my own results, Brogan, Allan and I had similar song lists, and this strengthen our connection. However, I did have a song that I had selected that Jennifer and Yi had also picked. However, the weakness of the degree of connectivity suggests that there might have been only 2 or less songs that were similar between Jennifer and Yi. The lightness of the edge highlights the lack of similarity between the selections that I had made that related to Jennifer or Yi’s list.
This highlights how individuals can have similar criteria on how or why they selected specific songs in their own golden curation list. Certain songs were picked by individuals. These songs were selected for various reasons from the Golden Record curation hit list. Now we do not know the “why” people made certain selections for their lists. This information would have further provided more valuable information. Simply put, we are relying solely on the algorithms purely based on data individuals put in when they completed the quiz.
What is missing is what is the link that has strengthen the high degree connectivity between these 6 main node networks. We are missing that qualitative data in understand why individuals made the selections that they did when they did in the graph. We know there is a relationship and the thicker the edges the more likely that those individuals had similar songs. But we do not know what was the specific criteria for these selections. For me, I know that area and unique instruments were a factor in some of my selections. However, this may not be the same criteria that other individuals used to determine their list.
It is difficult for adults to be like minded. As humans, we all have different interests and appeals. Trying to reduce a list from 27 songs to 10 songs, is difficult. To try to get uniformity among numerous individuals is extremely difficult. We all look at things through different lens and based our decisions on our own personal values and opinions. What this graph reveal is that at times we can find common ground and some songs are similar based on chance or interests. This graph highlights that we always have to look at the pairwise relationships between nodes. This information provides us with the necessary insight into analyzing why certain relationships might have existed. It shows why it is important to look at the connections between the main network and the individual nodes and provides us with some information to analyze further why certain relationships exist between individual networks and nodes.