
This page provides an overview of the conclusions that are important at a multitude of geographic and time scales and across all of the four storm surge scenarios derived for the project. The following table provides some key numbers for each of the scenarios and a link to further analysis of each scenario.
| Scenario | Area Flooded km2 | Buildings Vulnerable |
|---|---|---|
| 0m – Current Flood Risk | 134 | 2215 |
| 1m – Small Storm | 222 | 3510 |
| 2m – Average Storm | 296 | 4623 |
| 3m – Large Storm | 370 | 5634 |
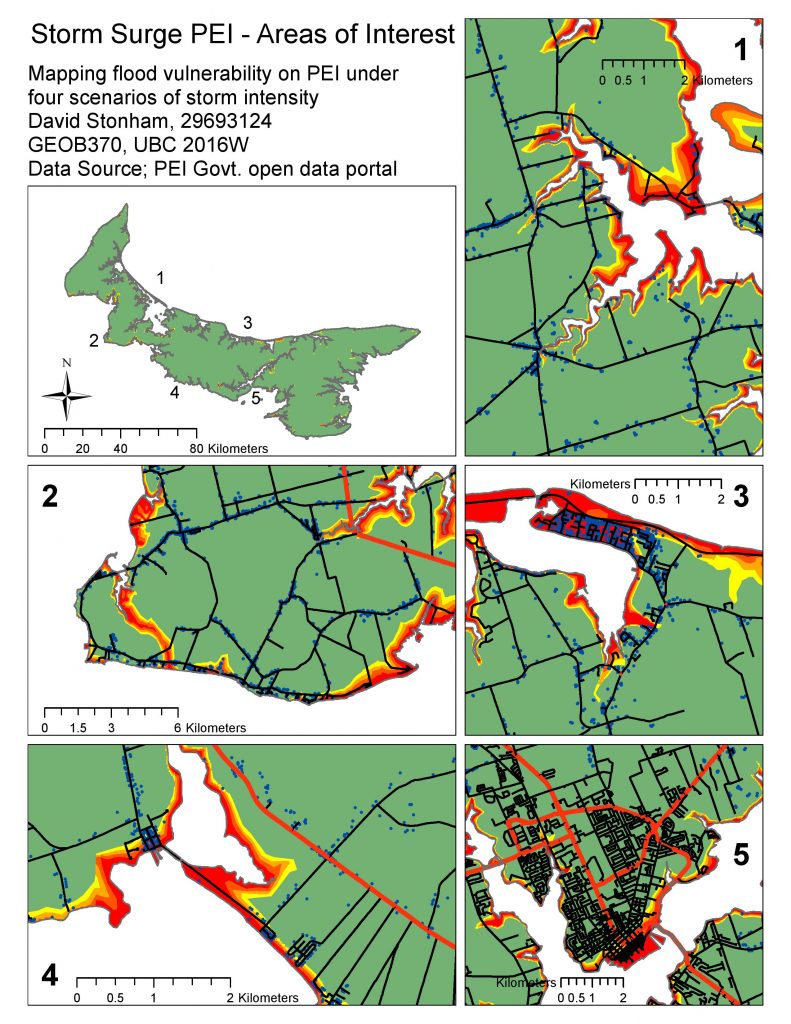
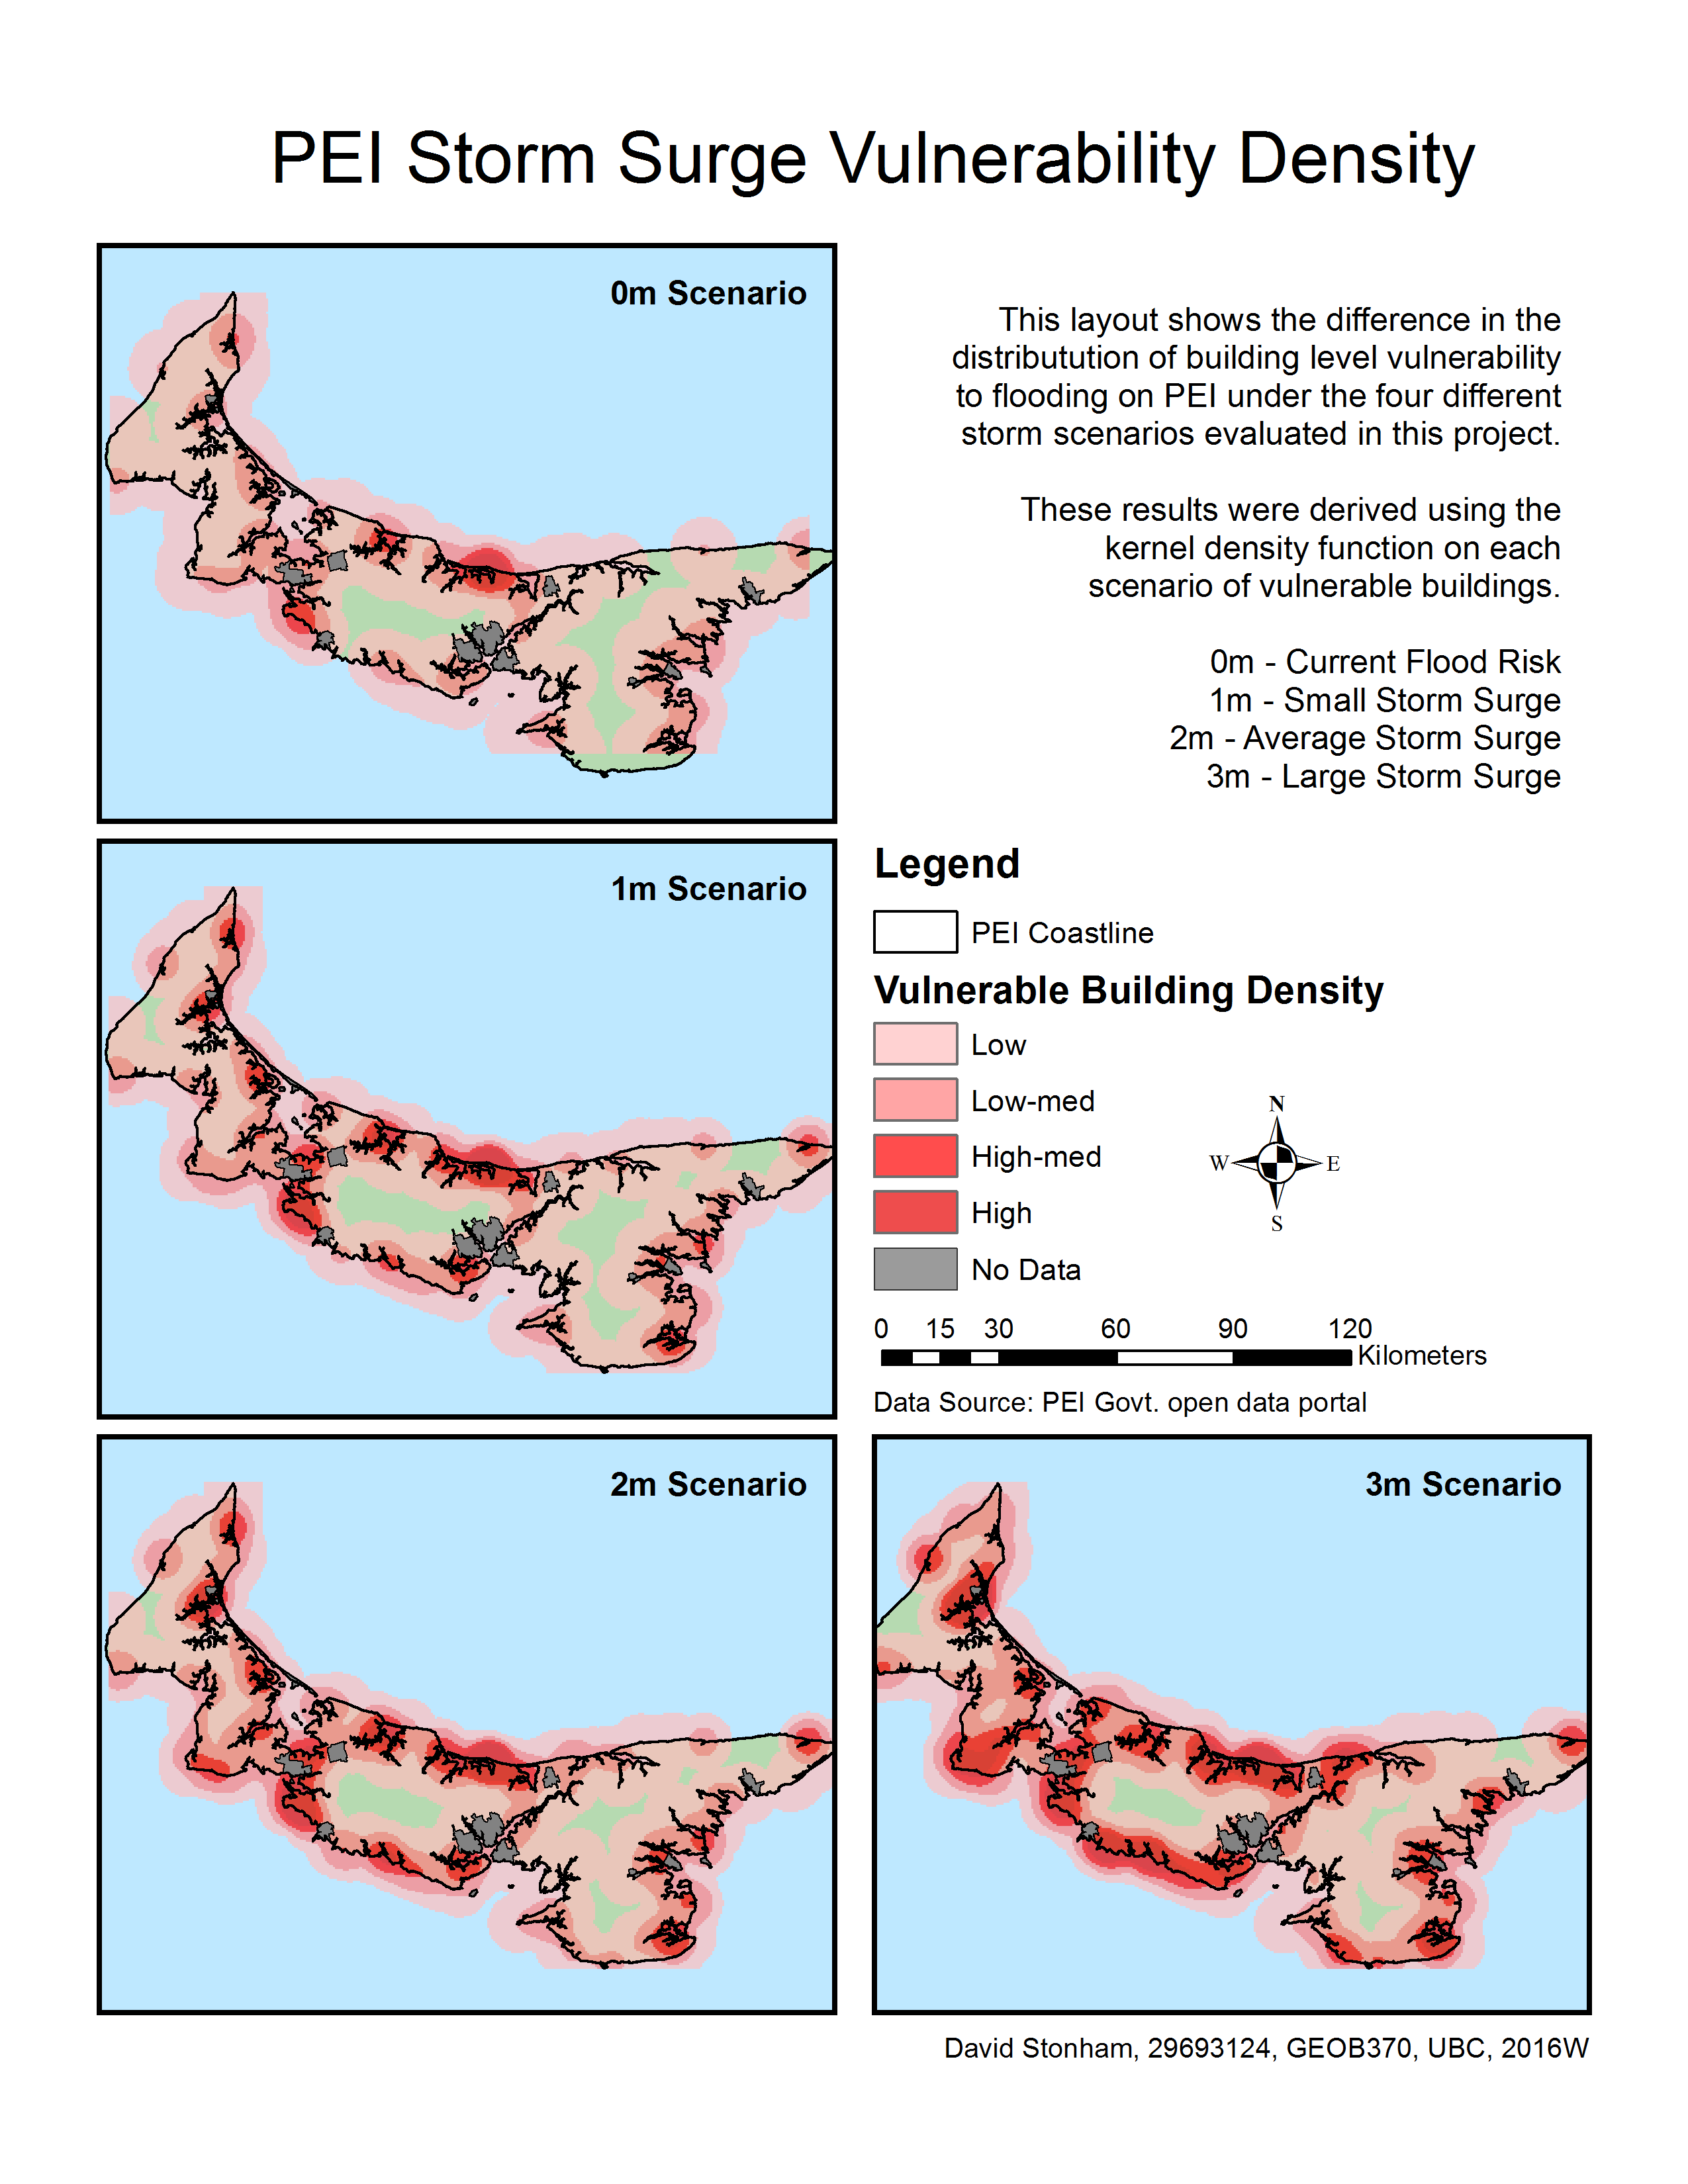
For the purposes of adaptation and hazard planning, understanding the distribution of vulnerability will be important for ensuring that resources are allocated properly. Using a kernel density analysis on the vulnerable buildings, I was able to highlight regions where a greater number of people might affected in each of the four scenarios. Looking at this map it is clear that in the 0m scenario, efforts on mitigation must be focussed on the Stanhope, Fernwood and French River communities. But in the event of a 3m Scenario, a larger than average storm surge, communities all across the Island will be affected.
Further Research
A more through geospatial analysis, including more data layers, may result in a different conclusion about the vulnerability of a particular location. Reconciling this with the real world situation will also always be necessary, as data can often be out of date or otherwise inaccurate. Through the use of GIS, it is possible for analysts familiar with hazard planning, to identify vulnerable populations and infrastructure and initiate a more thorough site survey to inform hazard mitigation planning.
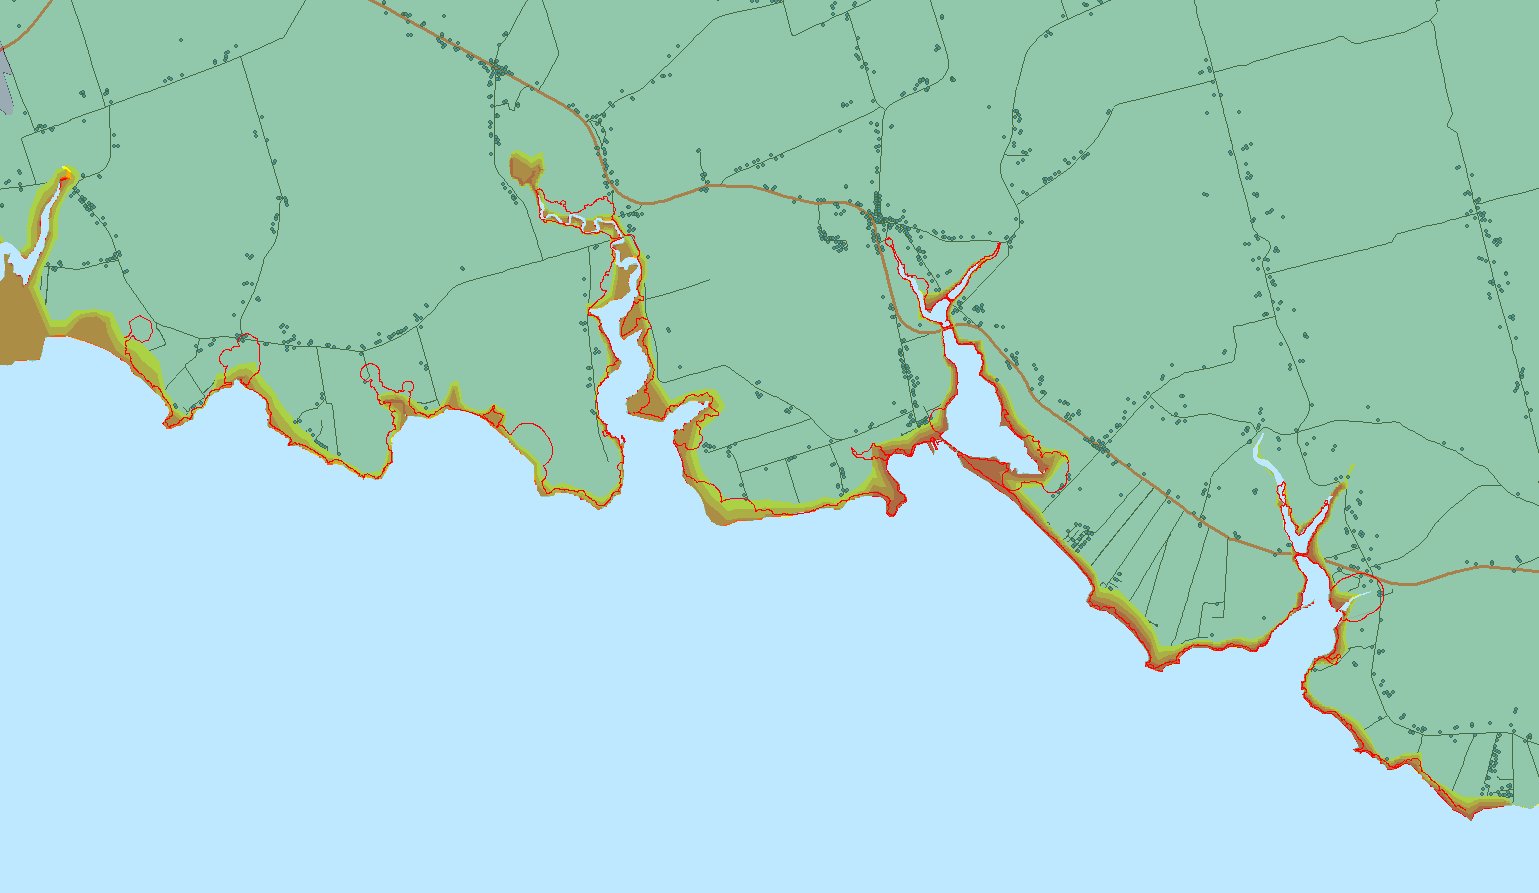
One example of further GIS analysis to better understand the vulnerability of areas in the future would be to combine my analysis with that of the UPEI Climate Research Lab on coastline erosion. The following image shows a sample area detailing their projection for the coastline in 2100 and how it compares to the three scenarios for flooding calculated in this project. It is clear that there are areas where simply looking at the elevation of the land does not fully capture the vulnerability of the communities.
Limitations and Sources of Error
Acquiring the appropriate data has been the most limiting factor of this project. The PEI open data portal has been useful, the range of data available is not particularly broad. in addition, several of the data files downloaded were incomplete or at a lower resolution than would have been desirable. The fact that buildings in Charlottetown and Summerside, along with the next four largest urban centres on the island were omitted from the buildings data file was frustrating, particularly given these areas had a high instance of land area vulnerable to flooding. Combining this with the higher population in the region, it is clear that this is a major limitation of the work.
A second limitation is in the resolution of the DEM downloaded from GeoGratis. By using values of elevation at the spatial resolution of 30m some buildings will be deemed vulnerable even though the local conditions point to a reduced vulnerability. This problem is known as the mixed pixel problem in GIScience, where more than one value can be present within the bounds of a single raster cell unit.