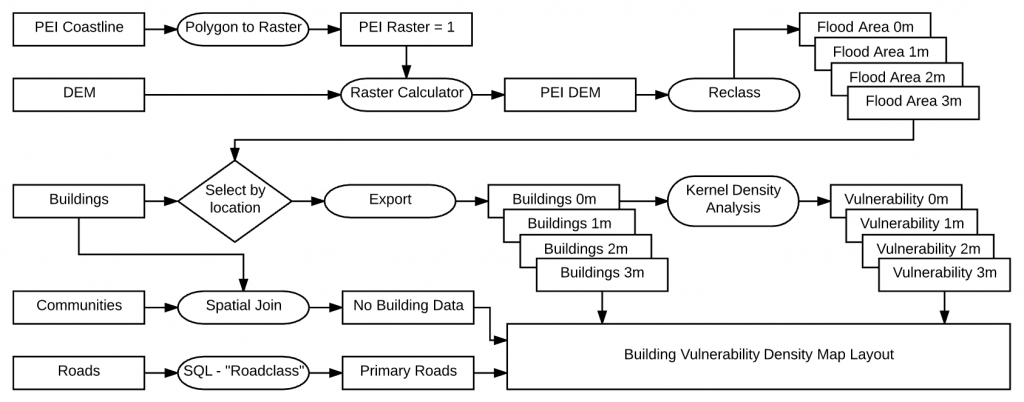
Once I had downloaded my data there were several things that needed to be done to clean it up. Not least ensuring that the each layer was projected properly into the “NAD 1983 CSRS Prince Edward Island” projected coordinate system.
PEI Boundary
This shapefile had many polygons that were not technically land which I needed to manually erase from the feature class. The sea surrounding the island was one, but others included rivers crossed by a bridge close to their mouth, and enclosed harbours. Given that I was working with hydrological features (i.e., the sea) I didn’t want the river to be mistaken as part of the land mass in future processes.
DEM -GeoGratis
I was only interested in the elevation of points within the boundary of PEI (not the elevation of the surrounding sea). I couldn’t simply select all raster cells that were greater than zero, because there were many points inside the provincial boundary that are recorded as having zero elevation -equating to a high vulnerability. Eventually, I converted the PEI Boundary shapefile to a raster, assigned the points inside a value of 1, and multiplied this layer with the DEM using the raster calculator.
Buildings
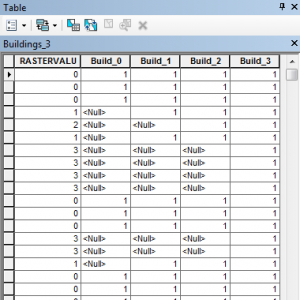
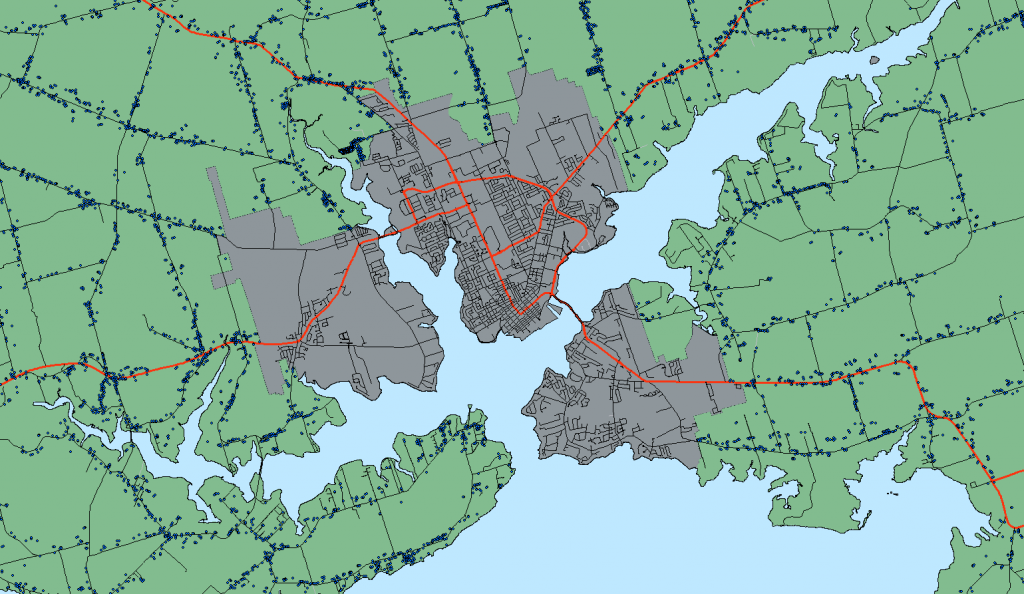
The buildings layer was only available as a .dwg file, and included multiple layers. I decided to convert the only the point layer to a shapefile, and discarded the remainder of the layers which included polyline boundaries of buildings. One drawback of using this layer is that the attributes do not distinguish between a building that is used as a primary residence, and those that are commercial or outbuildings. This information would have been helpful in order to estimate the number of people affected in each building. Additionally, buildings in ~6 of the major urban centres were excluded from the file, presumably they have their own local planning departments, so these had to be excluded from my calculations.
Roads
For the most part, the road data was complete and comprehensive, I symbolised the features using the road type attribute to give an idea of the size and priority of the roads. I also used the SQL statement “ROADCLASS” <> ‘Service Lane’ to remove all of the service lanes from the data displayed.