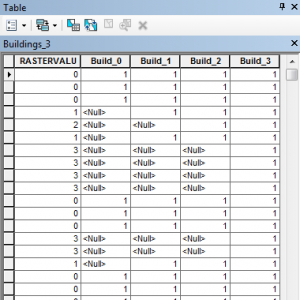
Using the “select by location” tool I was able to assign binary attributes to the buildings falling within each of the vulnerability zones, an attribute that was necessary for further analysis of the buildings in each of the four scenarios.
Using the “select by location” tool I was able to assign binary attributes to the buildings falling within each of the vulnerability zones, an attribute that was necessary for further analysis of the buildings in each of the four scenarios.
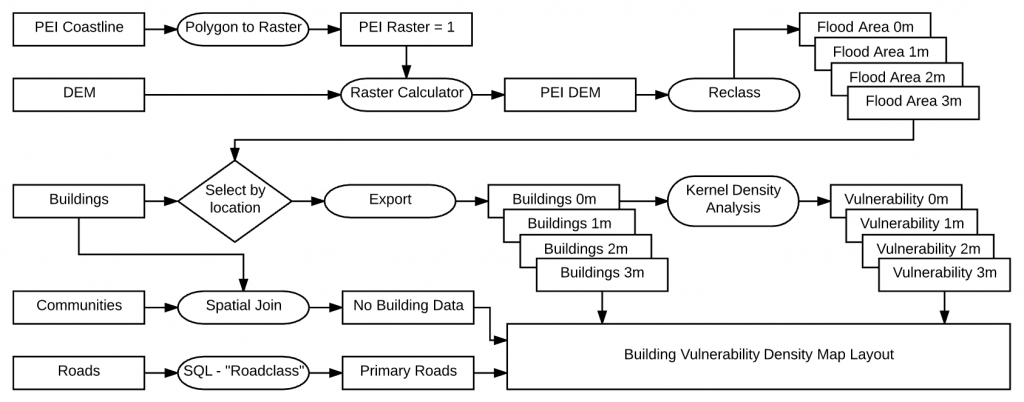
The following flowchart outlines the process I have undertaken to produce the vulnerability density map.