Determining Vulnerability Zones

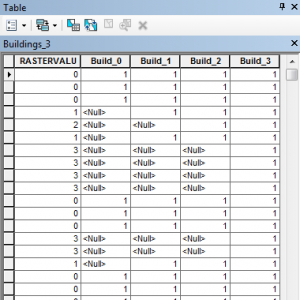
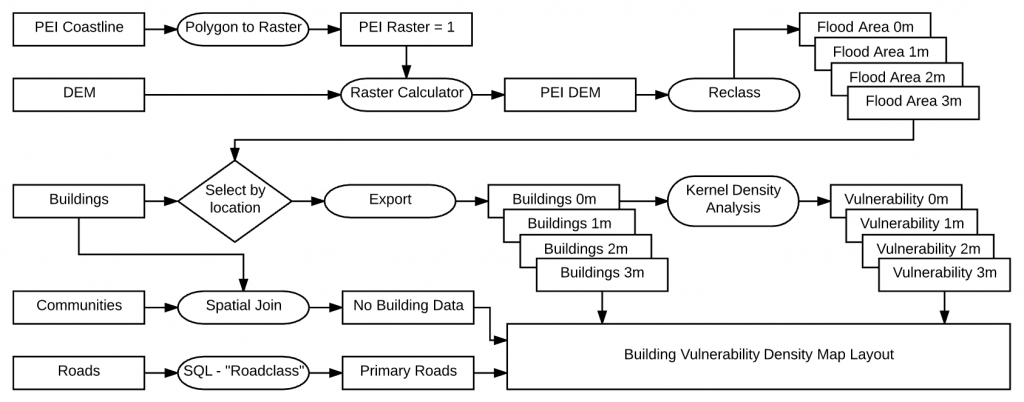
Using the digital elevation model (DEM) I was able to classify the data into four bands and export a shape file to represent each of the vulnerability scenarios. These shapefiles will be useful later in the analysis as I will be able to join attributes to the buildings that fall within their boundaries spatially.

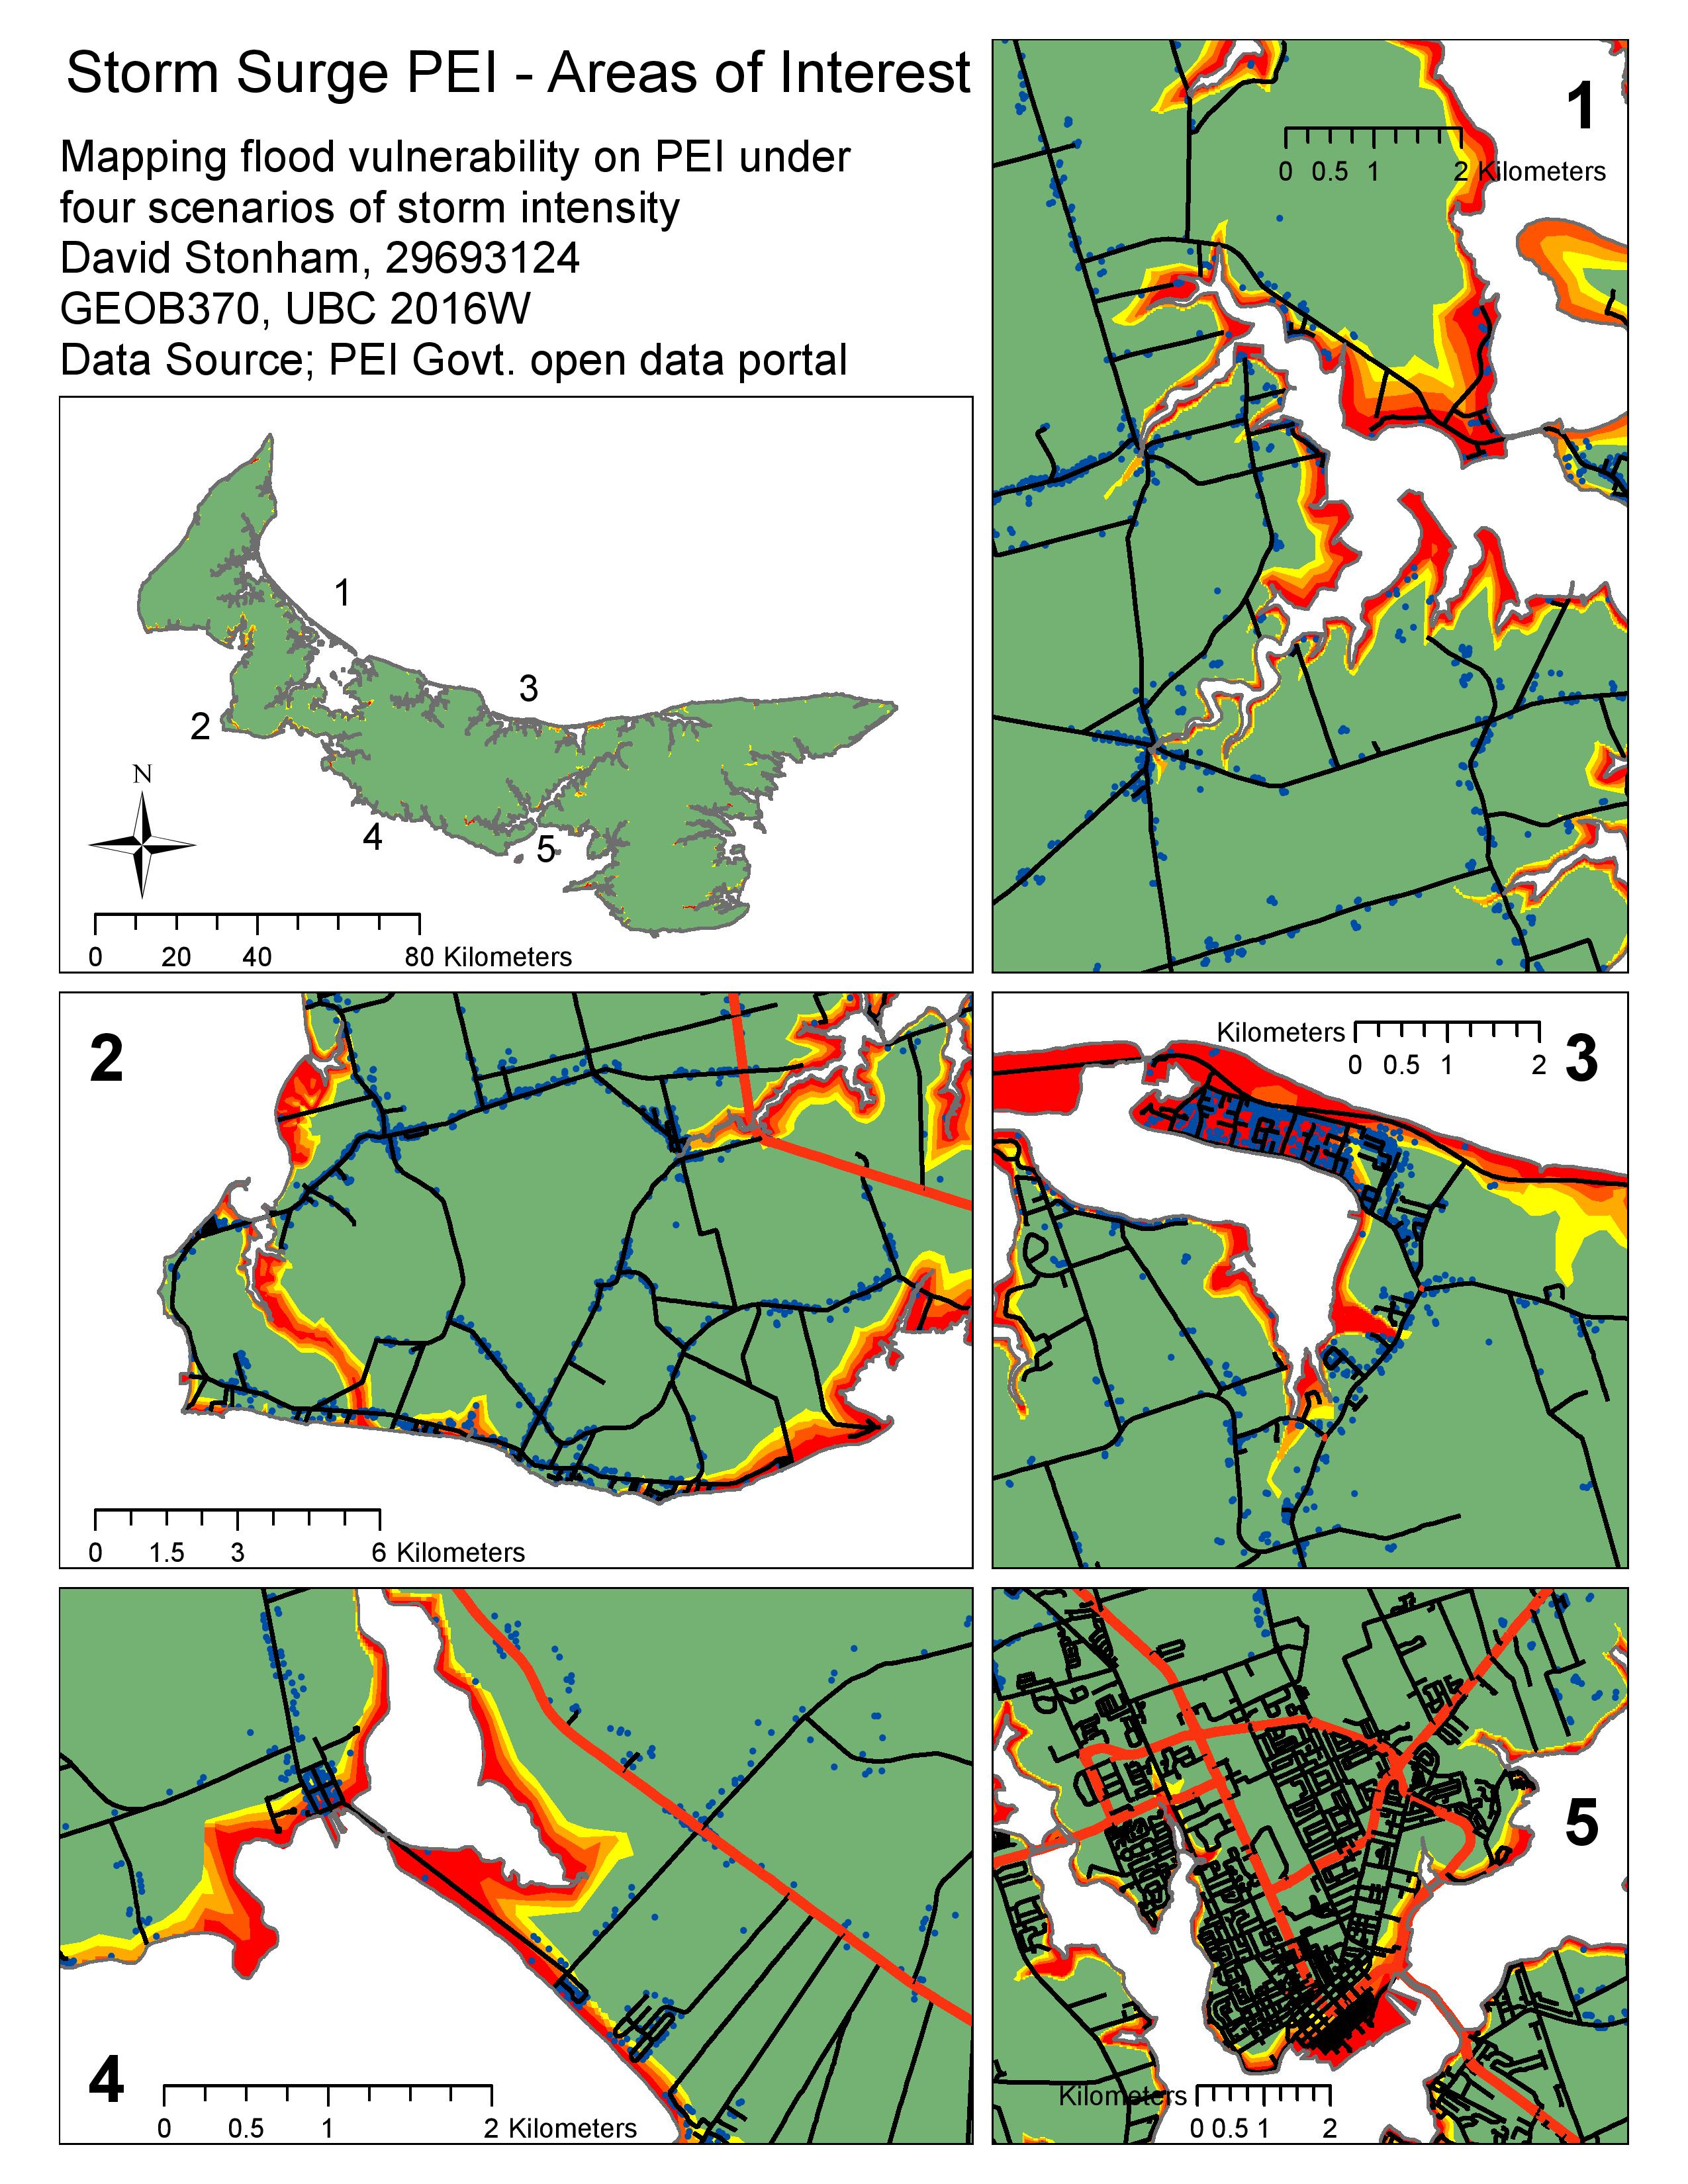
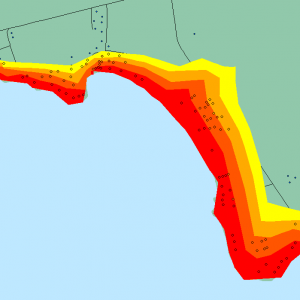
At this point I also created my first map layout which shows areas of special interest. Some areas like Victoria (inset 4) will likely experience major damage in the event of an average storm event and by the end of the century, after a 1m rise in sea level, the vulnerability will be greatly exacerbated.

vulnerability_areasofinterest
Areas of particular interest regarding flood vulnerability on PEI


Vulnerable Buildings

Using the “select by location” tool I was able to assign binary attributes to the buildings falling within each of the vulnerability zones, an attribute that was necessary for further analysis of the buildings in each of the four scenarios.

select-vulnerable-buildings
Select by location allowed me to classify buildings in each zone
buildingattributes
Additional fields in the attribute table provided tabular data useful for further analysis

Flow Chart

The following flowchart outlines the process I have undertaken to produce the vulnerability density map.

processchart
Flow chart describing the process undertaken to create the building vulnerability density map layout

Spam prevention powered by Akismet