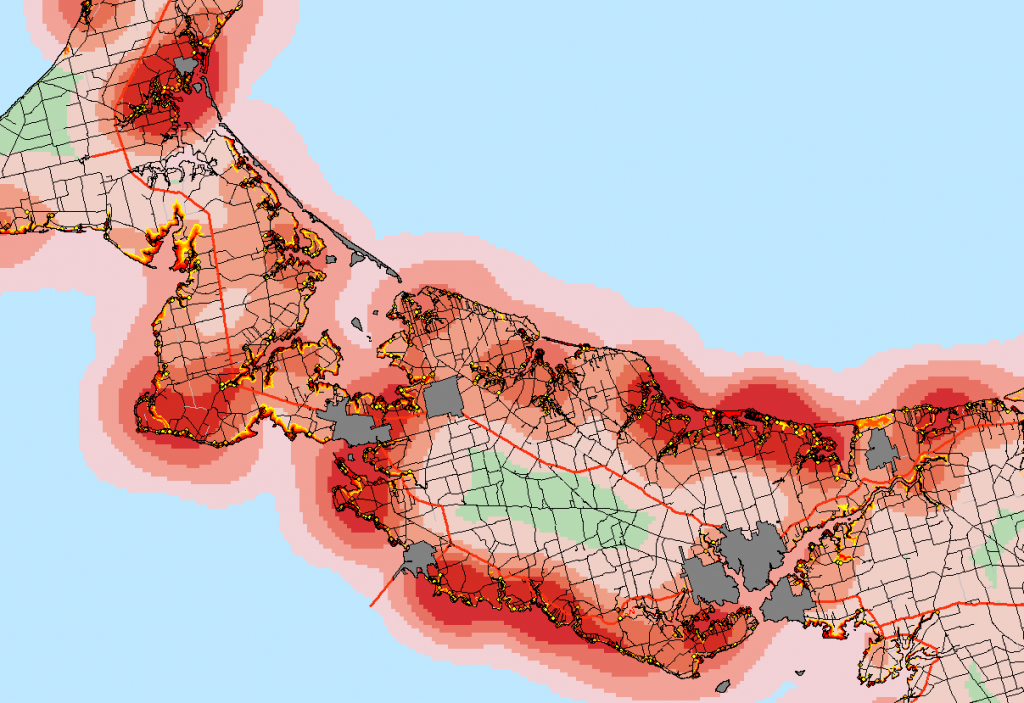
In order to establish areas of greater vulnerability and visually display them on my final map, I used the spatial analyst tool “kernel density” to highlight ares where there is are groups of vulnerable populations. This tool gives a good sense of the areas of importance, so I will replicate it for each of the four scenarios in the final conclusions phase.