Criminology and GIS

In the paper I selected, the authors explored the phenomenon of similar offences occurring in temporal and spatial proximity. These type of crime patterns are called near-repeat crimes. Near-repeat street robberies in Malmö, Sweden, were the selected for their analysis, and socio-economic data and criminogenic places used as independent variables. The same statistical test that we used in Lab 3 to investigate clustering both in space and time, the Knox test, was used in their analysis.

Both criminogenic and socioeconomic variables were found to be statistically significant for the regression model used. Fast-food restaurants,train stations, grocery stores, parks and ATMs had the highest probability of near-repeat crimes in happening in their proximity. Also, places with high population density and social deprivation were found to correlate with the occurrence of near-repeat crimes. The outcome of this study could be used to inform the local police force and try to decrease near-repeat crime rates by increasing police presence here.


Reference:

Rasmusson, M. & Helbich, M. (2020). The Relationship between Near-Repeat Street Robbery and the Environment: Evidence from Malmö, Sweden. ISPRS Int. J. Geo-Inf., 9(4),188.
Health Geography and GIS

Perceived access to health infrastructure in Leistershire, UK, was explored by  Brudson, Comber & Radburn (2011). The results of a postal attitude survey that was conducted in Leistershire in 2008 collected information on perceived access to general practitioners and hospitals connected to the postcode of the respondents. This data was used to perform a geographically weighted regression to assess dependence of the perceived access on physical distance, health/ill-health and car ownership of the respondents. They found long term illness, general health and car ownership were significant predictors of perceived accessibility to both GP surgeries and hospitals.

In-class presentations on different health geography papers using GIS analysis included the following interesting topics:

  • Epidemiology of infectious diseases such as SARS
  • Impact of environmental variables and climate change on the occurrence of diseases such as Lyme disease and Malaria
  • Access and travel time to health infrastructure
  • Influence of socio-economic status on health
  • Mapping of disease occurrence such as cancer or Malaria

I found the paper that Yulin presented particularly interesting, in which the distribution of childhood asthma in St. Louis, Missouri, was linked to socio-economic environmental variables. The topic of environmental injustice is certainly a grave issue in the US, where the health-care system is relatively inaccessible for less fortunate people. For me as an European the insecurity that must be connected to health in the States is unimaginable.


Reference:

Brunsdon C., Comber A.J., & Radburn R. (2011). A spatial analysis of variations inhealth access: linking geography, socio-economic status and access perceptions. International Journal of Health Geographics, 1, 44. doi: https://doi.org/10.1186/1476-072X-10-44

Lab 3: Crime in Ottawa

For the final lab of this course, we analyzed car thefts, robberies and B&E crimes in the Ottawa-Nepean area using the CrimeStats IV application. To assess the spatial distribution and autocorrelation of the different point data sets, both a nearest neighbor index and the Moran’s I index were computed and evaluated. Different hot spot maps for residential B&E crimes were then produced to compare fuzzy mode, nearest neighbor hierarchical spatial clustering and kernel density estimate approaches. In addition, the spatial and temporal – in this case time of the day – clustering of car thefts was statistically approached using the Knox index.

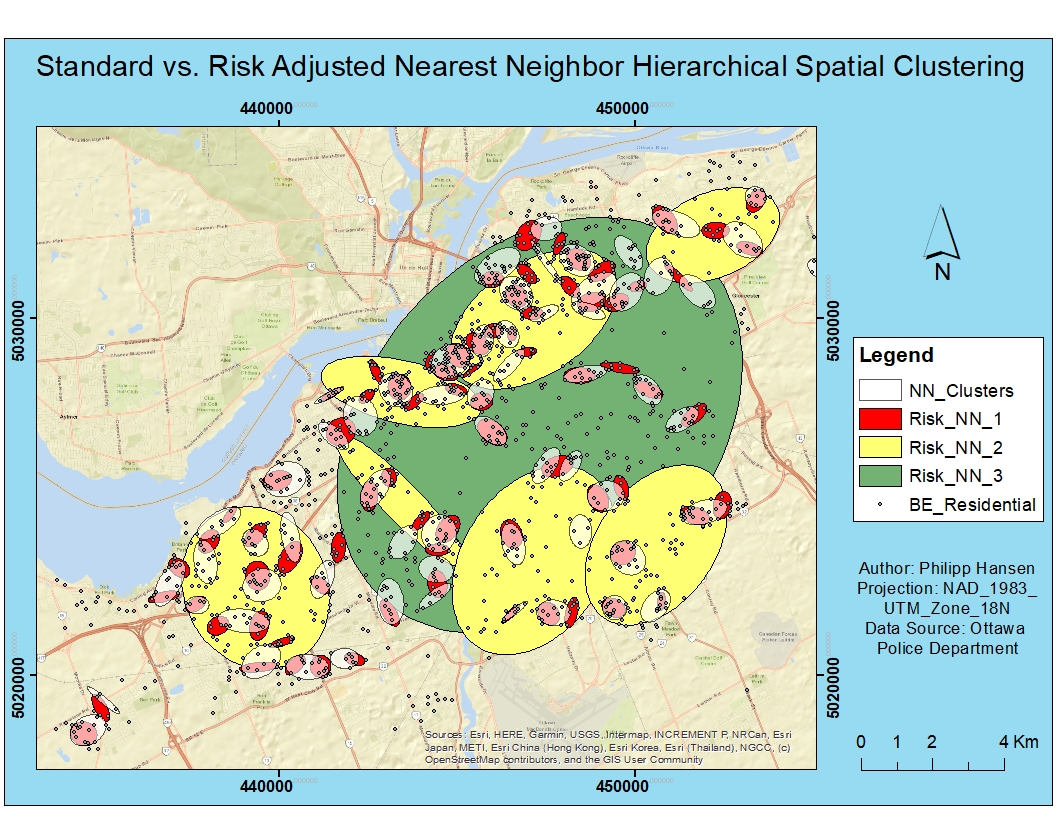
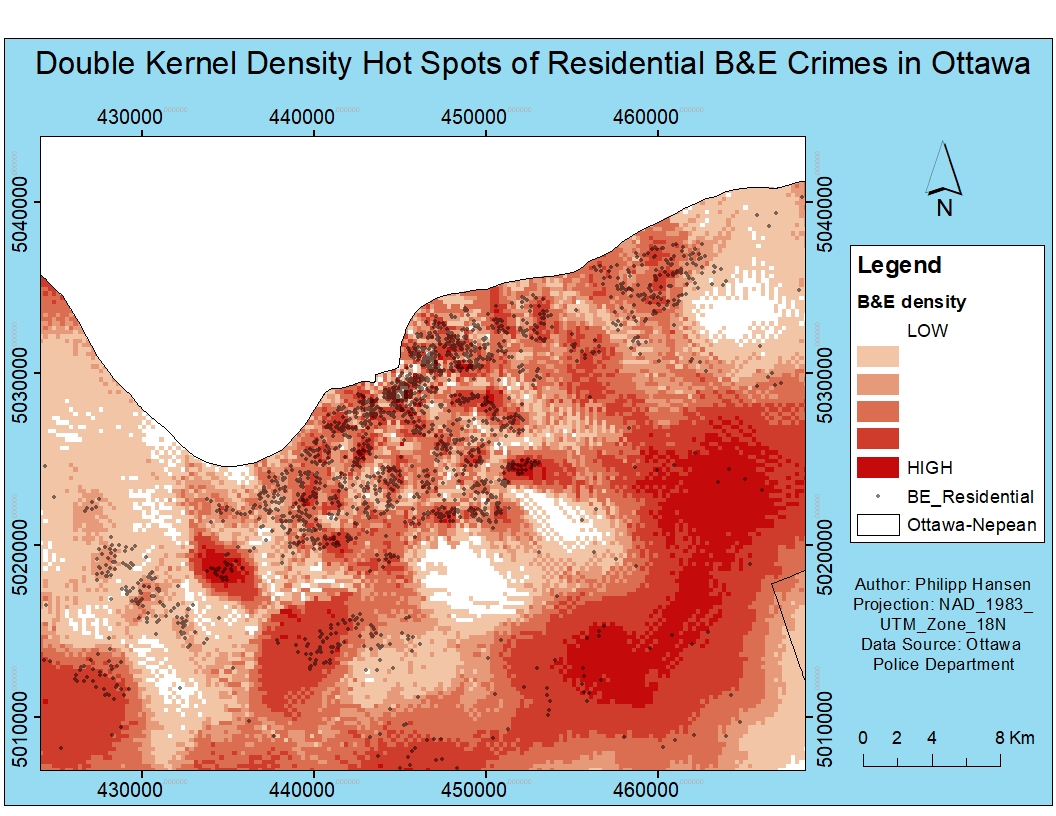
Two of the hot spot analyses are presented in the following maps:

Nearest neighbor hierarchical spatial clustering has been performed with and without taking into account the underlying distribution of the population. In addition, the population-weighted (or risk-adjusted) clustered have been clustered into second and third level clusters, indicating the greater area of higher residential B&E crime exposure.

The kernel density estimation yields a continuous grid surface with statistical crime density or risk exposure for each cell. The map below shows the population-weighted hot spots of this analysis for the urban Ottawa-Nepean area. Due to the low population density south of the city, a vast area has been assigned very high values, despite the relatively low number of crimes occurring here.

Environmental Criminology

Everybody that has ever watched crime series or movies has probably seen the mapping of crime patterns in one form or the other. While Sherlock Holmes used red pins to mark the locations of a crime on a paper map, the sophisticated use of GIS can reveal more detailed, statistical crime patterns.

Some of the spatial patterns of crimes and offenders can be explained by environmental variables. Within environmental criminology, the influence of the environment on the offender is analysed. While socio-economic disadvantages may have an effect on offences such as theft, other crimes might in part be caused by the effects of environmental pollution on people. The detected patterns of crime can be used to fight and prevent crime. As crime prevention is the ultimate goal of any authority, understanding patterns and their possible causes helps to develop effective strategies and allocate appropriate resources to reduce crime.

Lab 2: Geographically Weighted Regression

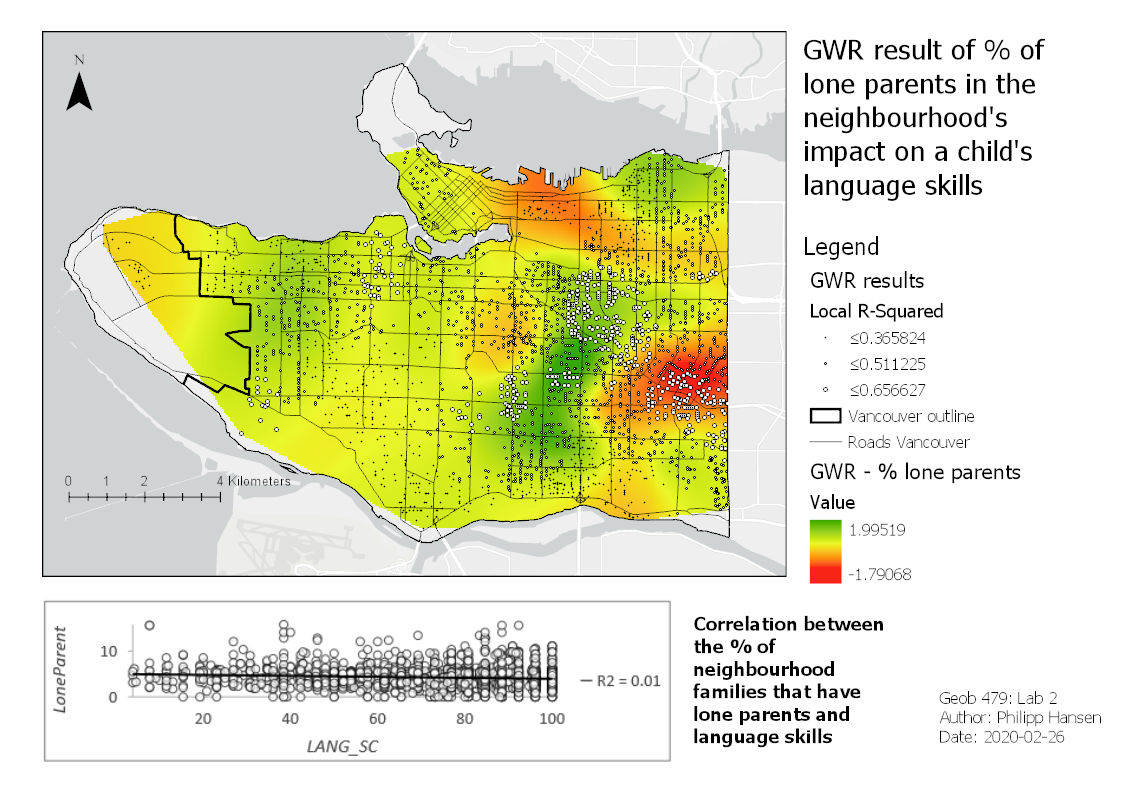
In this lab, we assessed the impact of several social-environmental variables in the neighborhood on the language skills of a child in Vancouver, BC. Standard regression methods work with the global distribution of the data points, which is not appropriate when analyzing the local spatial variations within a data set. Therefore, we performed a geographically weighted regression (GWR) in this lab, which performs a regression for every point of the dependent data set by distance-weighting the influence of the independent variable points.

Not a great amount of the child’s language skills could statistically be explained by the given social-environmental data. This does not come at a great surprise, as the variability in the language development is determined by many other factors such as the introvertedness or curiosity of a child.

The following map shows the output of the GWR for the influence of the percentage of lone parents in the neighborhood on the language skills of a child. As can be seen, there is some variability in the East Vancouver and the hot and cold spots visually seem to correlate with some of the higher R-Squared values of the GWR. The graph below, however, reveals that the correlation between the two lone parents and language skills is very low.

The study area has also been grouped into different neighborhoods with distinctly different socio-economic conditions.

Landscape Ecology and GIS

The paper I presented in class aimed to detect the variation of ecotones in an alpine, arctic biome using high resolution panchromatic satellite imagery. The study sites were two 8x8km QuickBird satellite tiles, which pictured two mountainous areas in the Yukon. In recent years, ecologists studying the arctic have increasingly found that climate warming is changing the composition of the biome and shifting the treeline northward as well as to higher elevations.

Different spatial analyses were used to determine the dispersion of trees in the landscape and the ecotone abruptness. By applying an unsupervised ISODATA classification in Idrisi, the study area was classified into different vegetation types. Both the influence of the slope angle and azimuth on the appearance of ecotones was evaluated and the authors found that there was less dense bushy undergrowth on northern slopes. Lower seedling suppression on northern slopes was thus suggested to increase the likelihood of treeline advances here.

Another paper that I found particularly interesting was the assessment of appropriate habitats for lynx in the UK by Amanda. If the habitat needs of species is well understood, the spatial modelling of possible reintroduction areas seems to me like a great approach. Reintroduction of keystone species is timely, costly and often met with skepticism and habitat modelling could help improve the success rate of reintroduction measures.


Reference:

Dearborn, K. D., & Danby, R. K. (2020). Spatial Analysis of Forest–Tundra Ecotones Reveals the Influence of Topography and Vegetation on Alpine Treeline Patterns in the Subarctic. Annals of the American Association of Geographers, 110(1), 18–35. doi:10.1080/24694452.2019.1616530

Health Geography and GIS

To infer information about the spatial distribution of health, GIS are a powerful tool. Health and ill-health are influenced by environmental as well as socio-economic variables. Many correlations between these and health have been identified and catechized using GIS, such as the distribution of hazardous blood lead concentrations  (Aboh et al., 2013) or access to health and socio-economic status (Brunsdon et al., 2011). Spatial epidemiology aims to explain and predict the spreading and spreading rates of diseases such as the infectious E. coli virus called EHEC (Kistemann et al., 2004). In the times of the global corona pandemic, the modelling of the disease distribution is more relevant than ever, and governments base their measures on scientific epidemiology models.

Useful spatial data is often found in census data or measurements of environmental factors. For some studies, surveys are conducted to collect information about perceived status and health access. Even remotely sensed data, e.g. on air quality inferred from hyperspectral satellite imagery, can be used in health geography.


References:
Brunsdon C., Comber Alexis J, & Radburn R. (2011). A spatial analysis of variations in health access: linking geography, socio-economic status and access perceptions. International Journal of Health Geographics1, 44.

Innocent Joy Kwame Aboh, P., Manukure Atiemo Sampson, Mp., Leticia Abra-Kom Nyaab, Mp. N., Jack Caravanos, D. C., Francis Gorman Ofosu, P., & Harriet Kuranchie-Mensah, Mp. (2013). Assessing Levels of Lead Contamination in Soil and Predicting Pediatric Blood Lead Levels in Tema, Ghana. Journal of Health and Pollution, 7.

Kistemann T., Zimmer S., Vågsholm I., & Andersson Y. (2004). GIS-Supported Investigation of Human EHEC and Cattle VTEC O157 Infections in Sweden: Geographical Distribution, Spatial Variation and Possible Risk Factors. Epidemiology and Infection132(3), 495.

Lab 1: Land use change in Edmonton, Alberta

Mankind is actively changing the landscape to make it more accessible, productive or fits the needs of our society in other ways. The change in land use in the Edmonton area, Alberta, between 1966 and 1976 has been assessed in this lab using data from Canadian Land Use Monitoring Program (CLUMP).

The quantify cation of changes in between 13 land use classes led to following results: “Urban built-up areas”and “productive woodlands” increased in extent within the decade at the expense of “cropland” and the less altered land uses “unimproved pasture and range land”and “non-productive woodland”. Urban sprawl has been suggested to be of concern in landscape planning, as many settlements are located on or adjacent to prime cropland. In addition, the extensive loss of natural or less adapted land use types has been identified. Problematic issues of habitat loss and deterioration of ecosystem services could arise due to these invasive changes of the landscape. Policy makers should consider the discussed economic and ecologic benefits when deciding on land use management.

The map below highlights a region south of Edmonton where the high conversion of extensively used pasture and range land into an urban built-up and outdoor recreation area. Unimproved pastures are one of the most biodiverse temperate ecosystems, so that the loss of this habitat could have adverse impacts on wildlife in the area.


Landscape Ecology & GIS

Landscapes are heterogeneous mosaics of ecosystems or different habitat niches, which are of interest for ecologists. The patterns of the elements within landscapes are studied at may different scales to draw conclusions about wide range of ecology topics such as species distributions dynamics, habitat loss & fragmentation and invasive species. Nowadays, the most pressing issues within landscape ecology relate to disturbance caused by human activity and many popular topics such as the loss of keystone species due to land cover conversions are broadly acknowledged.

GIS is used as a tool to visualize and quantify the patterns occurring within a landscape and evaluate the influence of processes acting on the landscape. Four groups of processes are distinguished here: abiotic, biotic, anthropogenic and natural disturbances. Abiotic factors are the underlying conditions governing the appearance of any place on Earth. The climate, soil properties and slope of a site determine the range of species that can possibly live here. Biotic interactions are given by the ecosystem itself in the from of competition or symbiosis, which create spatial autocorrelation. Disturbances happen naturally in the form of fires, storms, floods or other natural disaster. In recent history, humans have caused an unprecedented change in the landscape by land conversion, the introduction of species and even an greatly accelerated change of climatic conditions.