For the final lab of this course, we analyzed car thefts, robberies and B&E crimes in the Ottawa-Nepean area using the CrimeStats IV application. To assess the spatial distribution and autocorrelation of the different point data sets, both a nearest neighbor index and the Moran’s I index were computed and evaluated. Different hot spot maps for residential B&E crimes were then produced to compare fuzzy mode, nearest neighbor hierarchical spatial clustering and kernel density estimate approaches. In addition, the spatial and temporal – in this case time of the day – clustering of car thefts was statistically approached using the Knox index.
Two of the hot spot analyses are presented in the following maps:
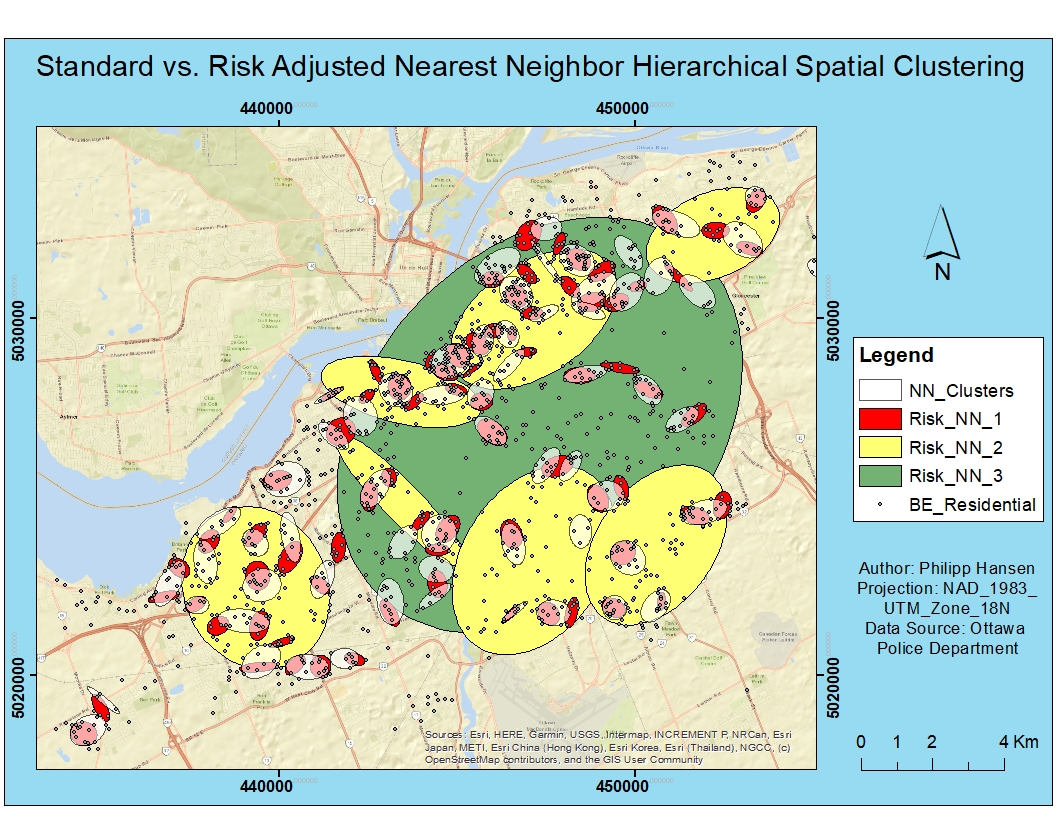
Nearest neighbor hierarchical spatial clustering has been performed with and without taking into account the underlying distribution of the population. In addition, the population-weighted (or risk-adjusted) clustered have been clustered into second and third level clusters, indicating the greater area of higher residential B&E crime exposure.

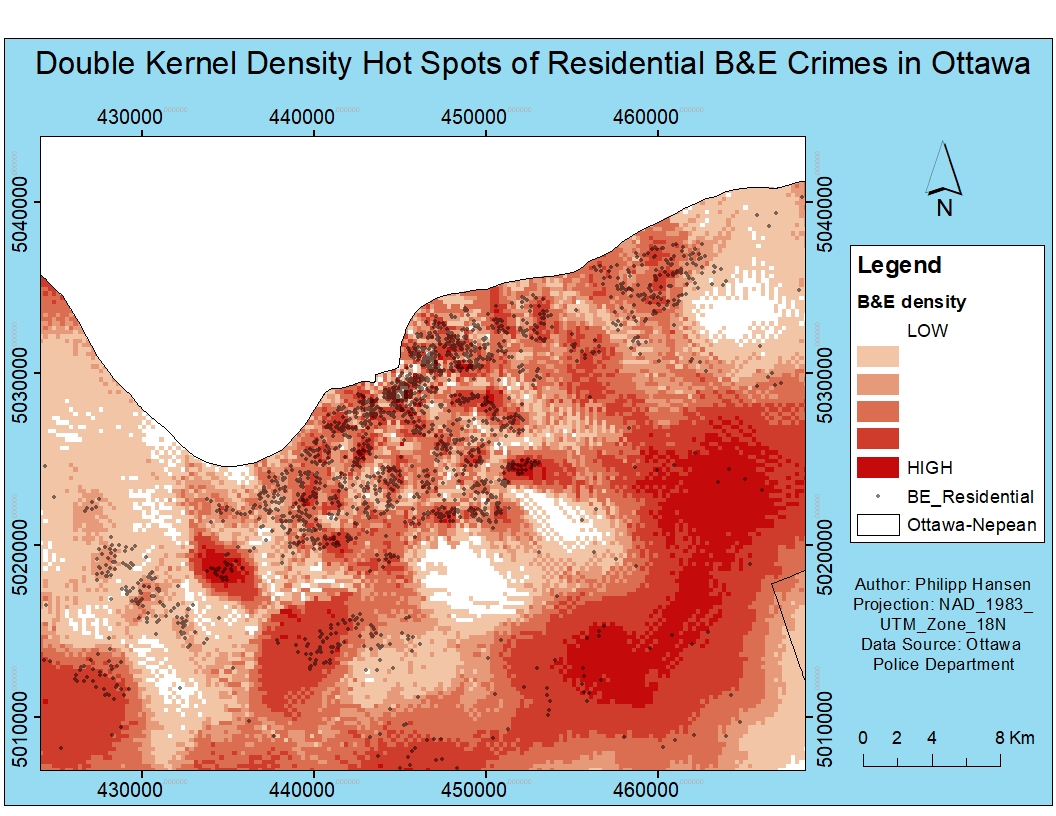
The kernel density estimation yields a continuous grid surface with statistical crime density or risk exposure for each cell. The map below shows the population-weighted hot spots of this analysis for the urban Ottawa-Nepean area. Due to the low population density south of the city, a vast area has been assigned very high values, despite the relatively low number of crimes occurring here.
