Labs

Lab 3: Crime in Ottawa

For the final lab of this course, we analyzed car thefts, robberies and B&E crimes in the Ottawa-Nepean area using the CrimeStats IV application. To assess the spatial distribution and autocorrelation of the different point data sets, both a nearest neighbor index and the Moran’s I index were computed and evaluated. Different hot spot maps for residential B&E crimes were then produced to compare fuzzy mode, nearest neighbor hierarchical spatial clustering and kernel density estimate approaches. In addition, the spatial and temporal – in this case time of the day – clustering of car thefts was statistically approached using the Knox index.

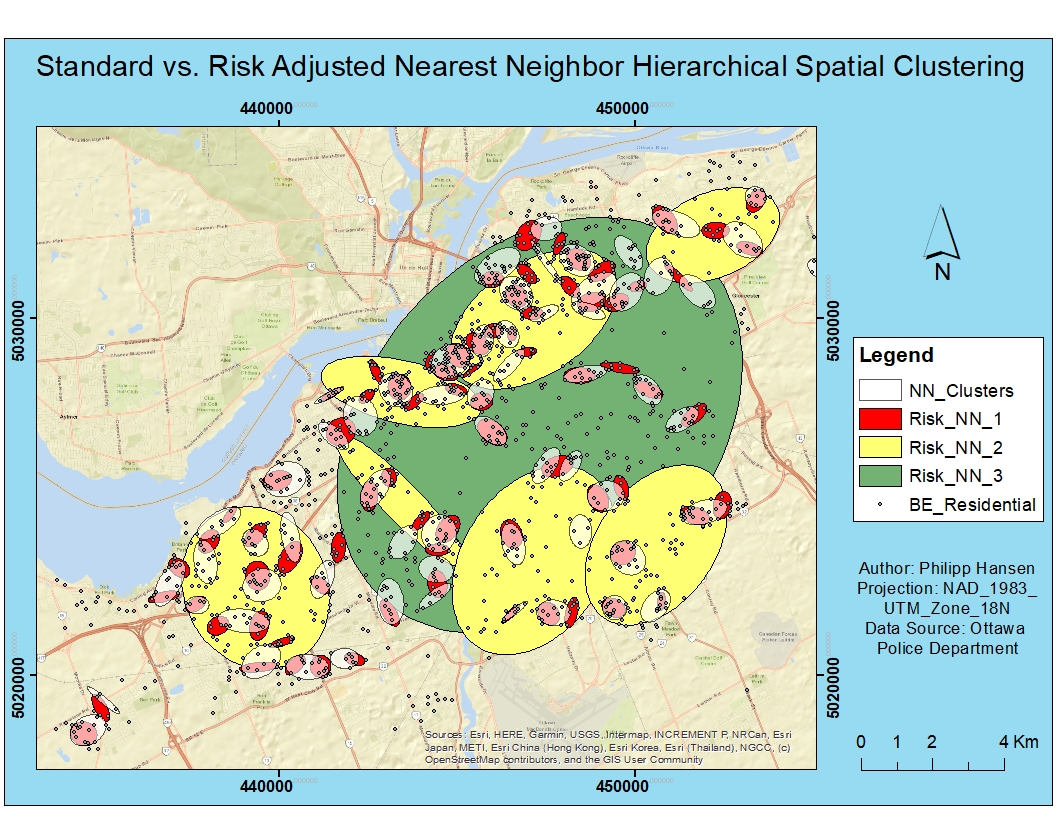
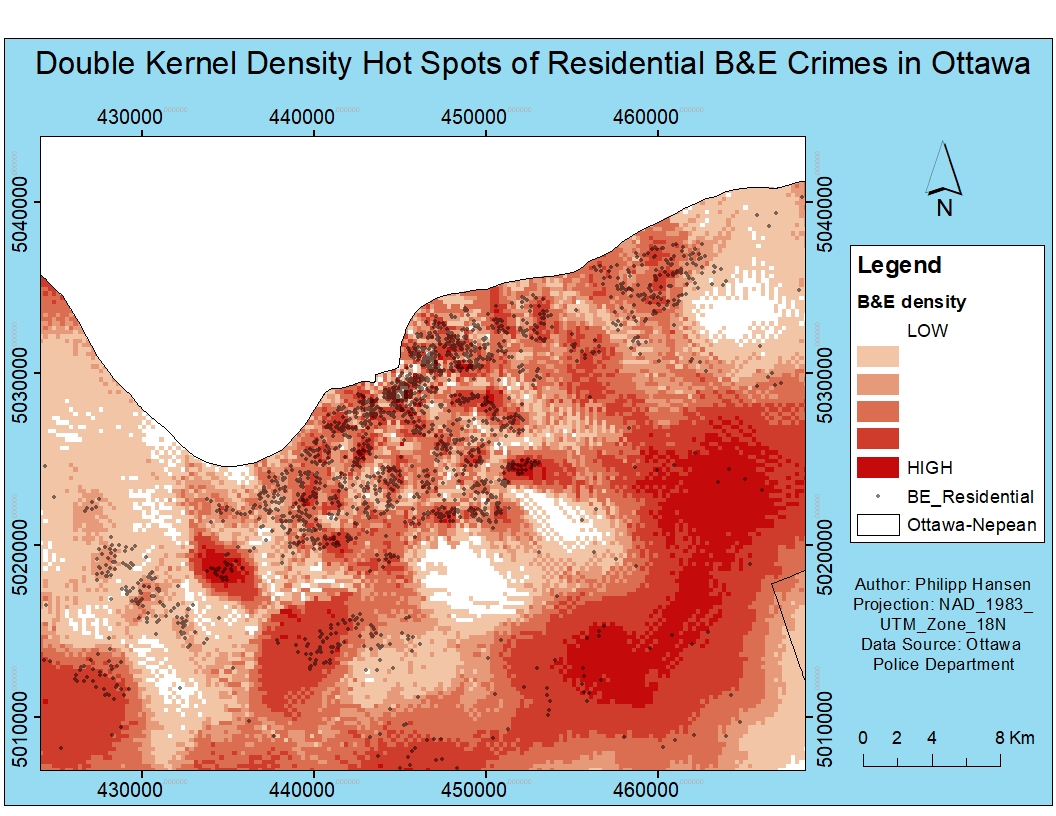
Two of the hot spot analyses are presented in the following maps:

Nearest neighbor hierarchical spatial clustering has been performed with and without taking into account the underlying distribution of the population. In addition, the population-weighted (or risk-adjusted) clustered have been clustered into second and third level clusters, indicating the greater area of higher residential B&E crime exposure.
The kernel density estimation yields a continuous grid surface with statistical crime density or risk exposure for each cell. The map below shows the population-weighted hot spots of this analysis for the urban Ottawa-Nepean area. Due to the low population density south of the city, a vast area has been assigned very high values, despite the relatively low number of crimes occurring here.
Lab 2: Geographically Weighted Regression

In this lab, we assessed the impact of several social-environmental variables in the neighborhood on the language skills of a child in Vancouver, BC. Standard regression methods work with the global distribution of the data points, which is not appropriate when analyzing the local spatial variations within a data set. Therefore, we performed a geographically weighted regression (GWR) in this lab, which performs a regression for every point of the dependent data set by distance-weighting the influence of the independent variable points.

Not a great amount of the child’s language skills could statistically be explained by the given social-environmental data. This does not come at a great surprise, as the variability in the language development is determined by many other factors such as the introvertedness or curiosity of a child.

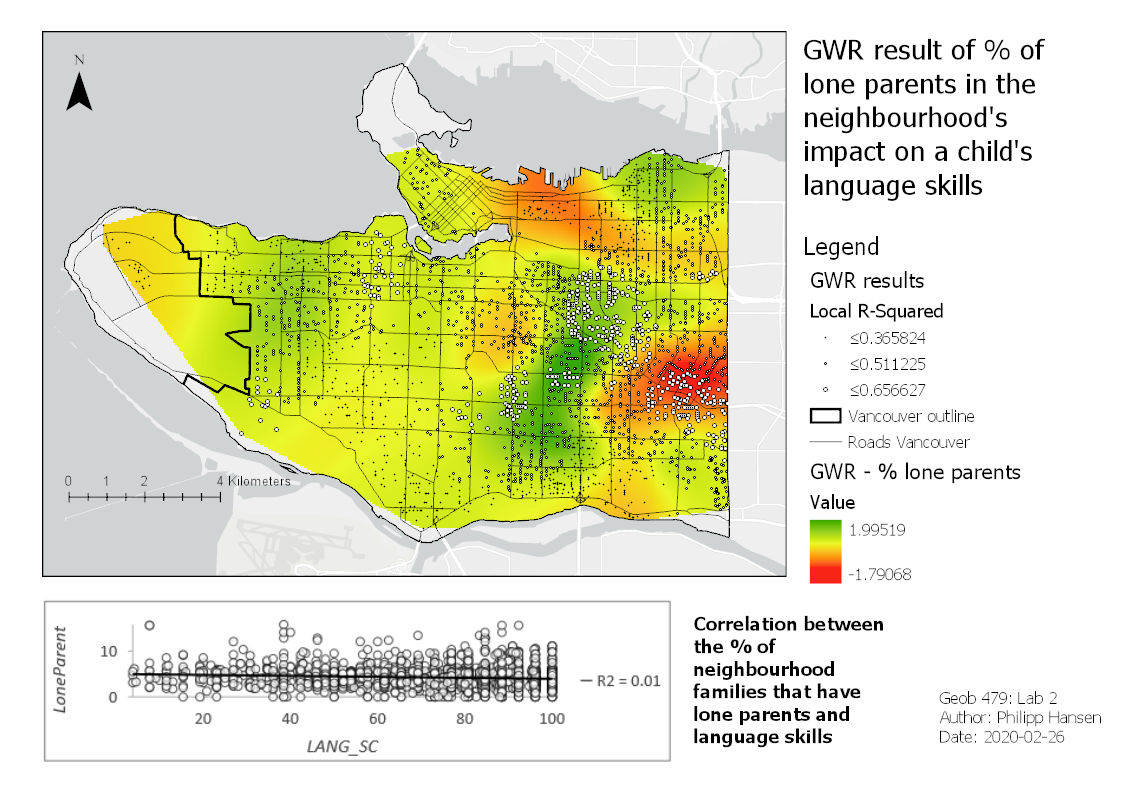
The following map shows the output of the GWR for the influence of the percentage of lone parents in the neighborhood on the language skills of a child. As can be seen, there is some variability in the East Vancouver and the hot and cold spots visually seem to correlate with some of the higher R-Squared values of the GWR. The graph below, however, reveals that the correlation between the two lone parents and language skills is very low.

The study area has also been grouped into different neighborhoods with distinctly different socio-economic conditions.

Lab 1: Land use change in Edmonton, Alberta

Mankind is actively changing the landscape to make it more accessible, productive or fits the needs of our society in other ways. The change in land use in the Edmonton area, Alberta, between 1966 and 1976 has been assessed in this lab using data from Canadian Land Use Monitoring Program (CLUMP).

The quantify cation of changes in between 13 land use classes led to following results: “Urban built-up areas”and “productive woodlands” increased in extent within the decade at the expense of “cropland” and the less altered land uses “unimproved pasture and range land”and “non-productive woodland”. Urban sprawl has been suggested to be of concern in landscape planning, as many settlements are located on or adjacent to prime cropland. In addition, the extensive loss of natural or less adapted land use types has been identified. Problematic issues of habitat loss and deterioration of ecosystem services could arise due to these invasive changes of the landscape. Policy makers should consider the discussed economic and ecologic benefits when deciding on land use management.

The map below highlights a region south of Edmonton where the high conversion of extensively used pasture and range land into an urban built-up and outdoor recreation area. Unimproved pastures are one of the most biodiverse temperate ecosystems, so that the loss of this habitat could have adverse impacts on wildlife in the area.