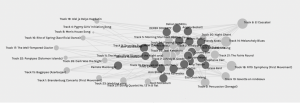
Since this was my first experience looking at Palladio graph, it took some time for me to understand the information; to interpret the connections and data being presented. Data has typically been presented in numbers and *graphs, and not in webs of strength-based connections. Filtering the data and looking at the communities made the web easier to understand. When I was able to isolate certain communities, I could see the common connections between users. I could assume their connections based on my knowledge of the music; however, this is all pre-existing knowledge. The graph made me wonder about the people in each community, and what other connections they have (e.g. age, gender, up bringing, geographical location). It would be difficult to understand the connections if the commonality was out of my realm of knowledge. It took some time engaging with the communities, filters, facets, nodes, to become comfortable navigating the information. Despite this, I am still unsure if I am interpreting the data correctly.
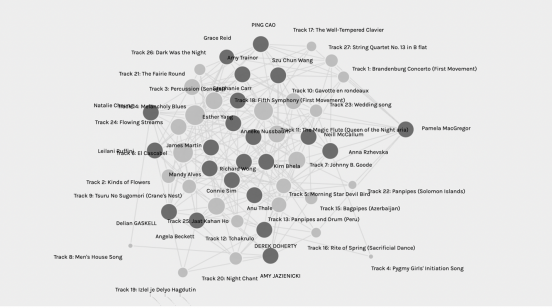
Image – Community 2

What data is missing, assumed, or misinterpreted?
Important data that is missing is why people chose the songs they did. I would assume others chose songs based on the same reason I did; based upon familiarity and personal taste. When reading peers’ responses to task 8, I discovered that everyone had a variety of reasons for choosing songs. There was a high number of people who chose a selection of songs that included global representation (e.g. a song from each continent). Another missing data point are what happens to the songs not chosen. Despite spending some time with the graph settings, I couldn’t see the songs that were not chosen or figure out if all songs were chosen. I’m assuming (again) that songs with the mostconnections were songs that were most chosen.
Below is a screen shot of a facet where I attempted to isolate nodes. I was putting all the songs with strong connections on the right-hand side, and all the nodes with minimal connections on the left. The songs in the middle had an average number of peers who chose them.