Discussion
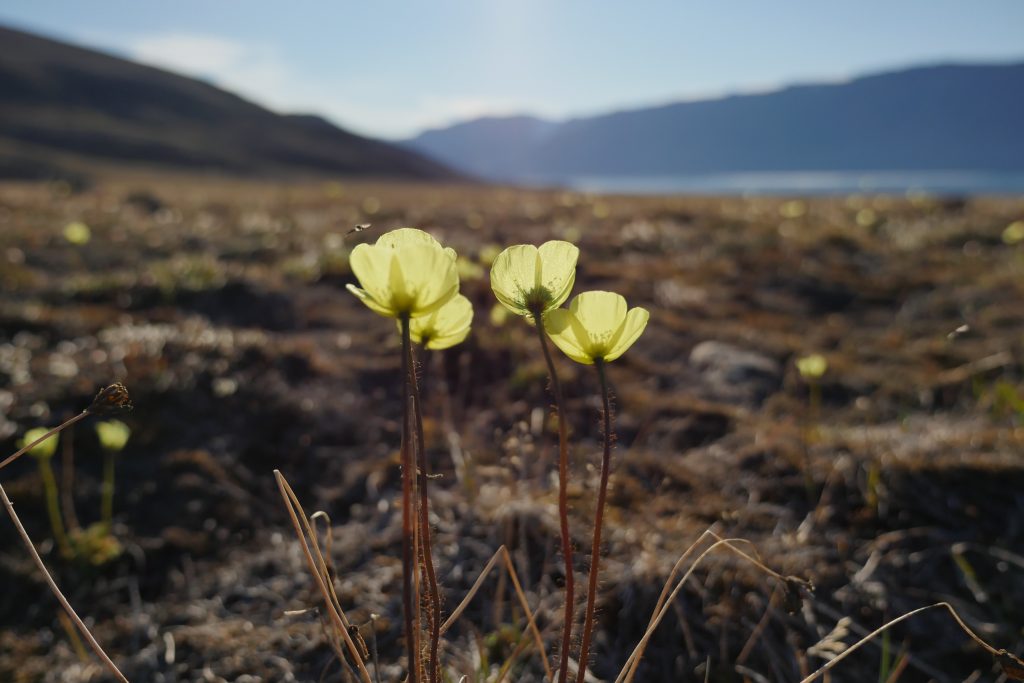
Papaver radicatum, or Arctic Poppy
Significance of our chosen parameters
We decided to include temperature, snow melt and solar insolation in our analysis because of their implications for community dynamics and direct relation to plant phenology in the Arctic. For example, temperature is closely tied to the community dynamics at multiple scales. For example, changes in temperature will have direct implications for the growing season length of individuals plants, and will determine individual success. Further, increased temperatures could be advantageous to one species over another and could lead to increased competition and potentially, competitive exclusion. Examining temperature patterns at a broader scale, an increased overall trend could lead to higher primary production overall, which would in turn contribute to polar feedback processes controlling climate, or could change conditions such that the ranges of species from further South can expand into the area. These are just a few instances of how temperature change can impact plant community structure at multiple scales.
In terms of snow cover, patterns of melt have a direct impact on water distribution and by extension, the habitat regimes of different plant communities. The rate at which snow melts will directly influence the development of plants. As mentioned in the previous section, plants also benefit from insulation provided by snow during the winter months. The length of the snow cover period and the rate at which snow melts then becomes a trade-off between help and hindrance; if plant are released from snow too early, they could become too cold and become damaged or die, however, if the plants remain under snow once the solar insolation period increases it will infringe on the length of the growing season, which is already relatively short in the High Arctic. This parameter is particularly relevant now with the impacts that global climate change is already having on precipitation patterns, which are of particular threat in the polar regions. Precipitation has been increasing as temperature increases, and this can result in higher maximum snow depths, which in turn will delay snowmelt in the spring and complicate the overall snowmelt process in some regions.
Solar insolation, a measure of the solar radiation received on a given surface in a given time, was included because plant phenology and distribution are affected by the angle of the sun and the amount of solar insolation that they receive. At this latitude in the summer, the sun does not set, and therefore the insolation period, and plant growth as a result, is intense and short. In our analysis it would have been nice to include alternative insolation scenarios. We looked at overall average insolation from the period when the sun rises above the horizon (February 10th – November 1st) however looking at other times of year, for example a shorter period that more closely approximated the plant growing season (ie. June until August) would have been a more useful period to use for analysis.
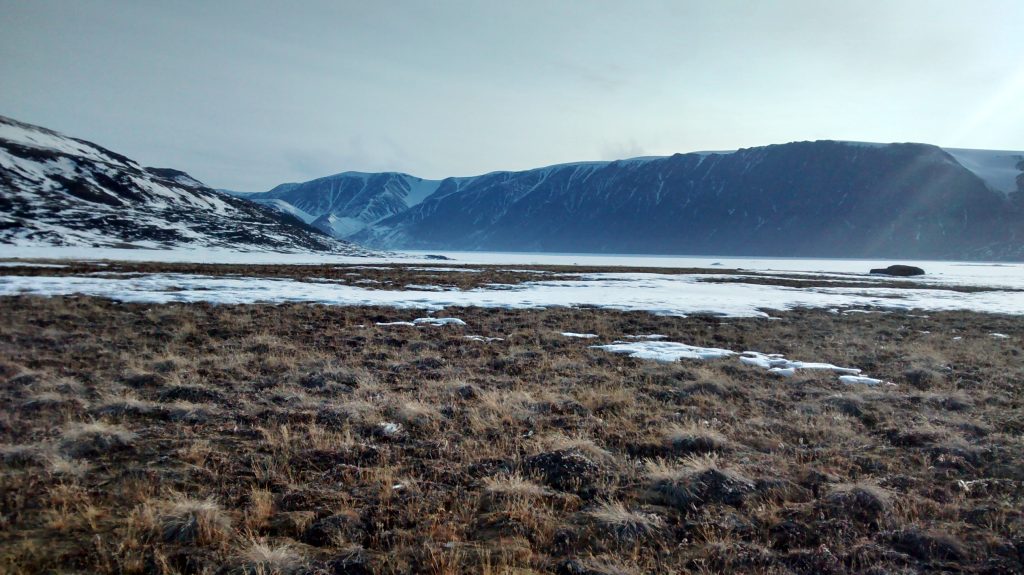
Tundra during snow melt. Photo courtesy of Danielle Black.
Limitations
In terms of data, we encountered obstacles and limitations that have compromised the accuracy of our project and unfortunately had a profound effect on the desired outcome of our analyses. We were given a wealth of data in a pre-existing geodatabase consisting of a wide variety of different . This data, as previously discussed, has been collected by many different individuals for a variety of research objectives over many years. Because of the amount of data we were given, much of our time in the early stages of the project was spent cleaning the data and selecting which data was important to our analyses – which was a very small portion of all the data we were given. Overall, much of the data was outdated and some of it was incomplete. Across parameters, data was inconsistently sampled spatially in terms of precise geographic location and extent, and also temporally in terms of when the samples were taken. The lack of spatial and temporal consistency in the data has made cross-comparison invalid. We lacked up-to-date and consistent data across our chosen parameters. For example, we had to use temperature data from both 2000 and 2010, plant community data from 2000, snow melt data from 2000, and had aerial photos from 2000. Considering how rapidly changes are occurring in the Arctic, up-to-date data on these parameters is necessary in order to provide a relevant analysis.
An important parameter that we would have liked to include in our project was soil moisture, however, the soil moisture data that we were provided was missing both spatial and temporal data and we were unable to acquire it in time to include it in our analysis.
Overall, our project is a first step in a more robust analysis and has provided us with a great deal of insight into developing an appropriate methodology for analysis, and data collection and organization. We will hopefully be able to investigate further this summer and into next year.
References:
Elphinstone, Cassandra. Equitable matrix techniques to determine spatial and temporal patterns in temperature, snowfall, and phenology and the resulting effects on High Arctic plant communities. Honours Thesis, University of British Columbia. 2016. Email from author. November 14th, 2016.
Svoboda, Josef, et al. Ecology of a Polar Oasis: Alexandra Fiord, Ellesmere Island, Canada. Captus University Publications, 1994.
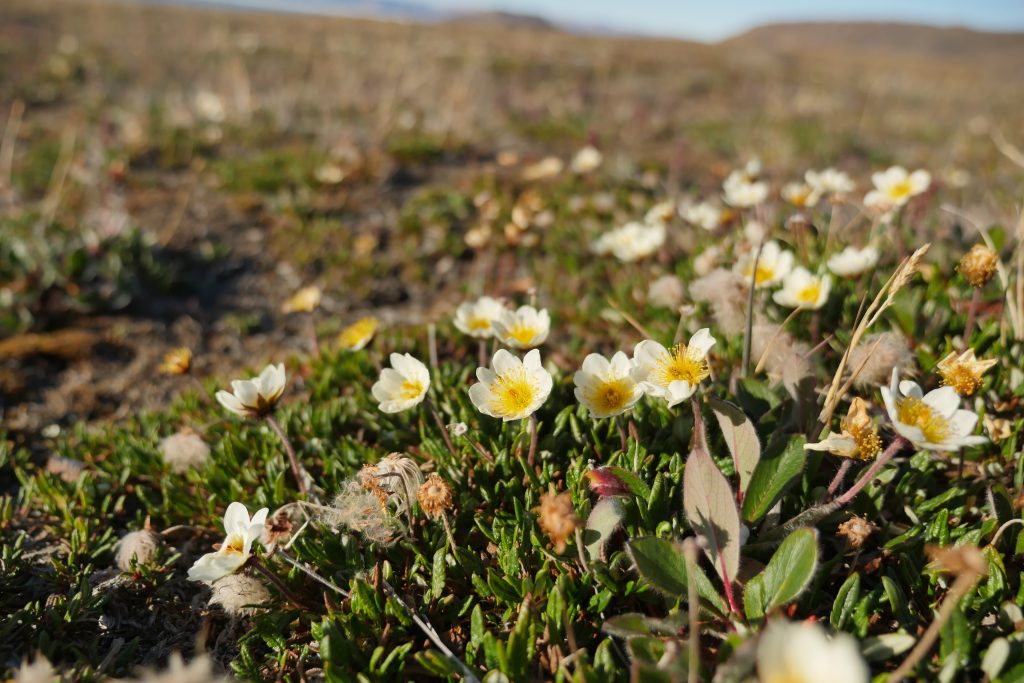
Dryas integrifolia