
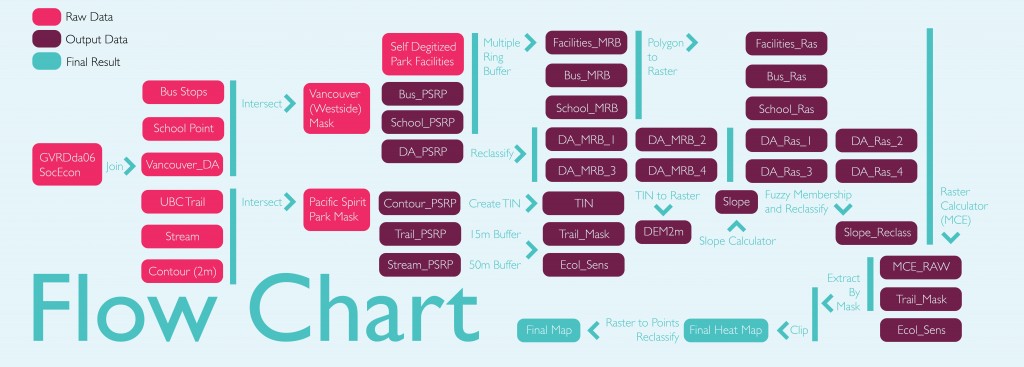
- Join GVRDda06SocEcon table to Vancouver_DA, which contains F2 (Population).
- Intersect Bus Stop, School Point and Vancouver_DA with Vancouver (Westside) Mask.
- Intersect UBC Trail, Stream and Contour (2m) with Pacific Spirit Regional Park Mask.
- Self Digitizing a SHP point data for facilities in the Pacific Spirit Regional Park.
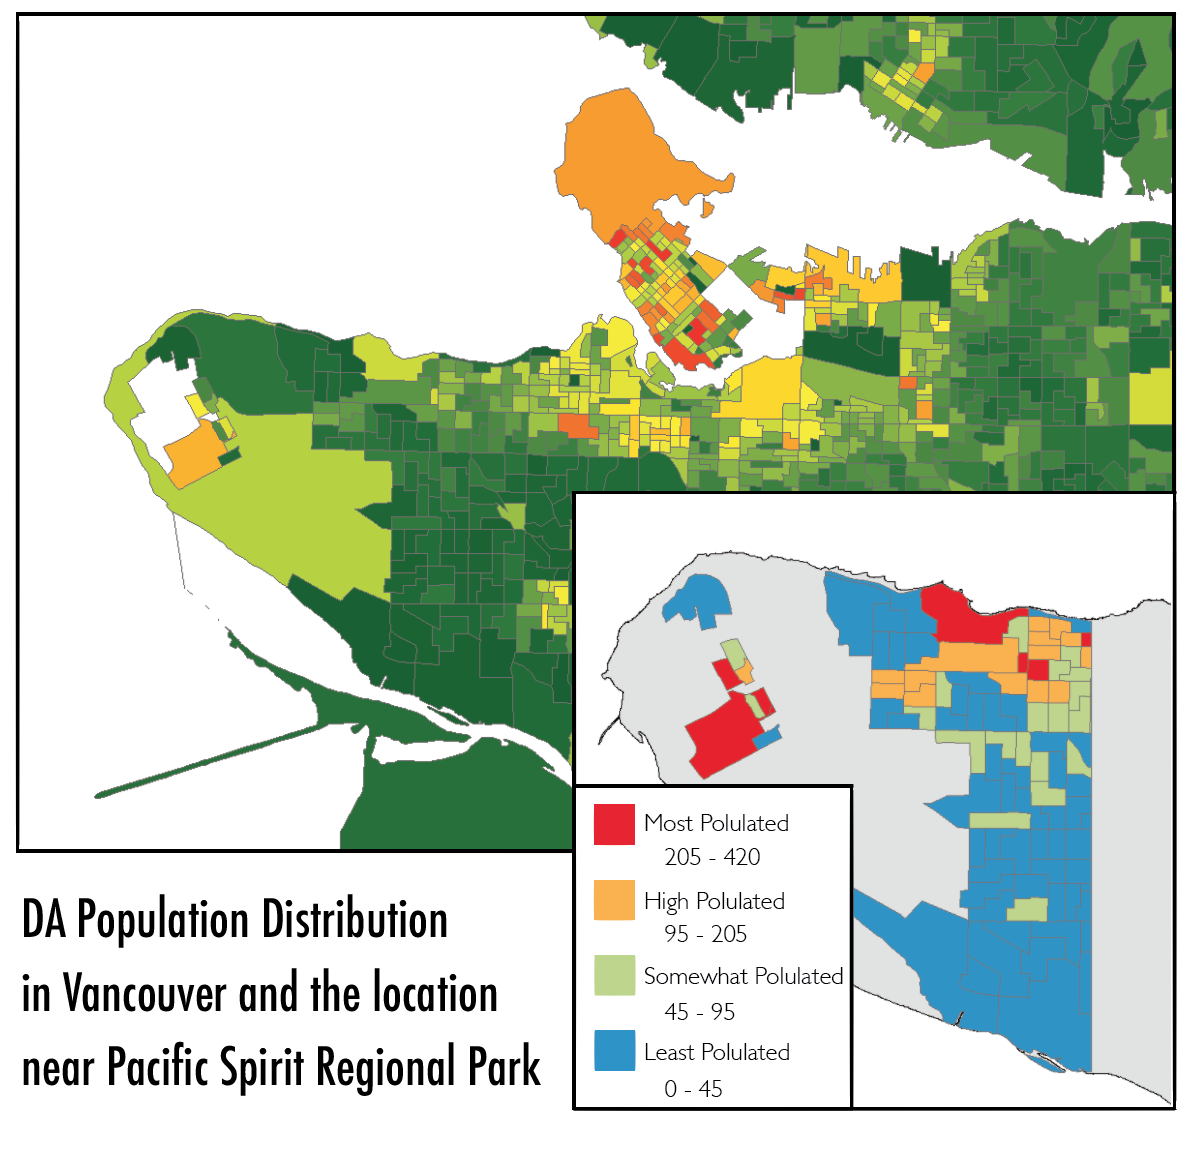
- Reclassify the DA_PSRP (DA close to Pacific Spirit Regional Park) to 4 classes.
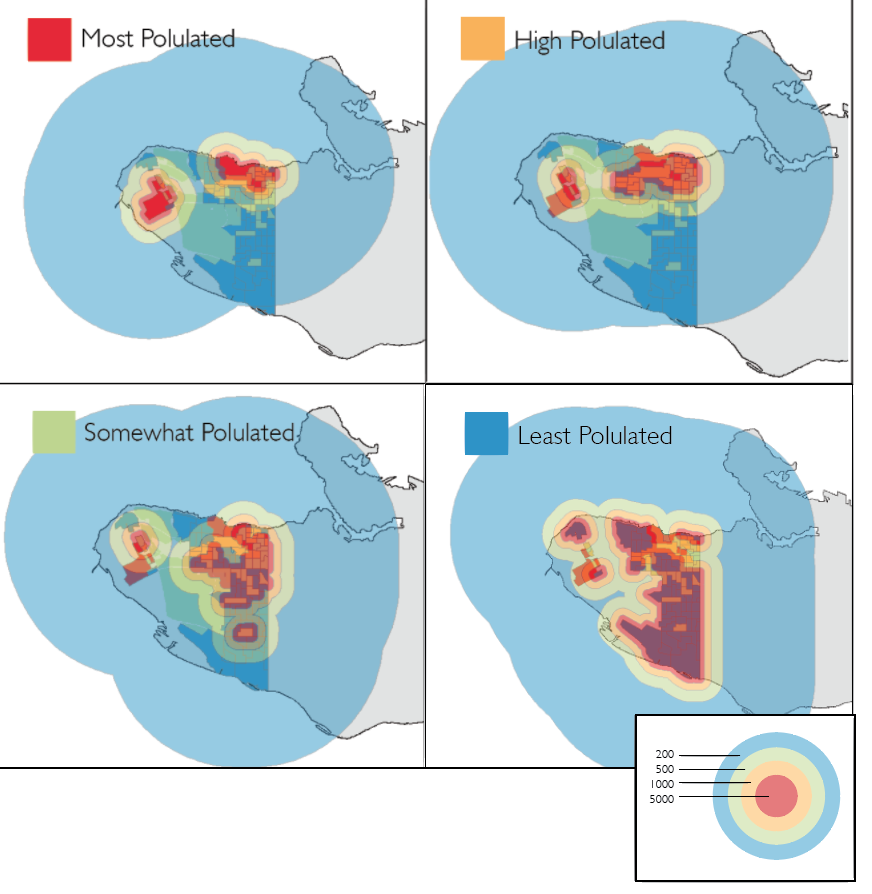
- Operate Multiple Ring Buffer specifically for the 4 classes of DA polygons as well as the Facilities, Bus Stop and Schools.
- DA: 200, 500, 1000, 5000 (m)
- Facilities: 200, 500, 1000, 5000 (m)
- Bus Stop: 100, 500, 2000, 5000 (m)
- Schools: 200, 500, 1000, 5000 (m)

- Convert each vector buffer to raster by using Polygon to Raster tool.
- Numericalize the elevation data in contour line’s attribute table.
- Create TIN from contour line in PSRP region.
- Convert TIN to Raster to generate a DEM.
- Use Slope Calculator to generate the slope.
- Reclassify the slope into 4 classes.

- Run the Raster Calculator to operate MCE by using Raster Calculator:
- School: 10%
- Bus Stop: 10%
- Facilities 30%
- Slope: 30%
- Population Density in Each DA Class: 20%
- class 1: 50%
- class 2: 30%
- class 3: 15%
- class 4: 5%

- Buffer 15m from the UBC trail.
- Extract by Mask the generated raw MEC with the buffered trail.
- Buffer 50m from the stream in PSRP as the Ecological Sensitive Area.
- Clip the Ecological Sensitive Area out from the result.

- Convert from Raster to Points for the MCE Final Result.
