For a detailed, high definition version of the maps, please click on the hyperlinks below each map.
Map 1. Network Analysis of Existing Safety Hubs
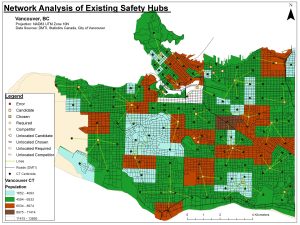
This first map assumes that none of the existing hubs are in danger of getting destroyed in the event of a megathrust earthquake occurring in Vancouver. This map yielded the following results:
- CT centroids located closer to safety hubs are better allocated than further away centroids. Given a population cutoff of 6500 people was assigned as a limit for each safety hub, city centroids located closer to the hubs got on average 98% of their population cutoff accomodated, in comparison, further away CT centroids only obtained an average of 65% of their population cutoff accomodated.
- There was a safety hub that was not given use. Due to the high number of designated safety hubs in the East Hastings region, the East Hastings disaster hub was not assigned population because all other surrounding hubs accommodated all of the local population.
Map 2. Network Analysis of Existing Safety Hubs Excluding those at Risk of Structural Failure
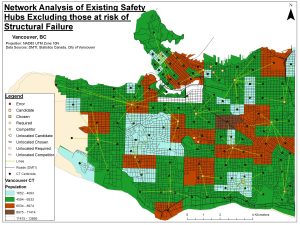
The second map considers the worst-case scenario, where the 5 hubs located in dangerous areas and 2 other hubs in potential danger are identified and removed from the analysis leaving only 20 functional safety hubs.
- Hubs in danger: False Creek, Killarney, Roundhouse, Trout Lake and Creekside.
- Hubs in potential danger: Hastings and West Point Grey.
We see that when these 7 hubs are removed, there is quite a bit of pressure put on the remaining hubs. The greatest strain appears to be placed on the hubs in the West End, where 1 hub is expected to support roughly 12 CT centroids and their populations. A similar case is seen the East Vancouver area. Furthermore, each of the preesent hubs provides support for a wide range of centroids, from 1 up to 10 or 12, showing a rather uneven distribution of the allocation of these populations. Interestingly, regardless of the removal of the 7 hubs, the Hastings disaster hub is still ignored by the program, meaning there are a few areas of error in the tool.
Map 3. Network Analysis of Existing Safety Hubs and Potential Schools
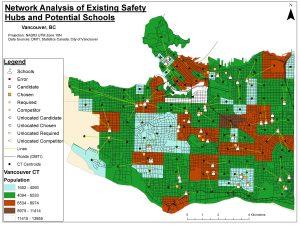
In this part of the analysis, the tool selected more disaster facilities, better balancing the distribution of hubs within the city. These facilities (or hubs) show that over 60-75% of max. capacity are allocated (excluding 3 hubs which were at 20-40% out of the 50 locations that were selected).
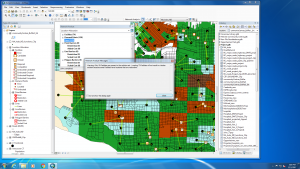
It appears that the tool only selected 50 locations out of the 73 that we input. The locations that were excluded was due to the fact that these were in “redundant locations” as seen in the following image:
This setup, however, shows a more even distribution of CT centroids with respect to the available locations (these being both disaster hubs and schools). In this case, some of the schools are ignored as well, but the tool selects the closest locations to maximize attendance, and it appears that some of these schools do not meet these requirements.
Map 4. Proposed Locations for Potential Safety Hubs
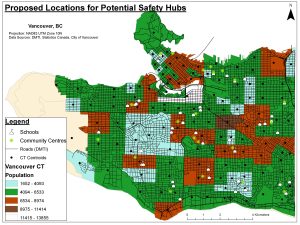
Map 4 suggests the best-suited schools and community centres that could become safety hubs given the high numbers of people expected to need help after a megathrust earthquake.
For a discussion and analysis of the above-mentioned maps please go to the “Discussion and Future Steps” tab above.