by Rachel Lam, Brian Tan, Senhao Huang, Patrick Van Den Brink
Abstract
This project aims to depict the best assisted living residences in Vancouver, British Columbia. With Canada’s baby-boomer population (people born between 1946 – 1964) steadily set to reach the age of retirement, Canada’s elderly population is on the rise. In 2016 Canada’s seniors outnumbered children for the first time ever. In 2017 16.8% of Canada’s population was composed of people aged 65 years and over. Because of this growing elderly population, the demand for assisted living residences is expected to also be on the rise. Using geographic information systems and available datasets this project illustrates the locations of Vancouver’s assisted living residences to nearby emergency services including fire stations, police stations and hospitals, while also depicting recent break-and-enter crimes. Furthermore, this project displays the proximity of these assisted living residences to public transport stations as a way of measuring their accessibility. All this was done as a way to inform Canada’s growing elderly population of the best assisted living residences to live in the Vancouver area.
Description of Project
In this project, we assumed the role of an independent consulting group to investigate the best assisted living residence in Vancouver by providing more information on their access to emergency services, prevalence of crime and access to public transport.
We will map the location of ‘assisted living residences’ in Vancouver, along with the location of hospitals, fire stations, police stations, bus stops and incidents of break-and-enter crimes within the last five years. Using a road network dataset, we can determine which assisted living residences are closest to emergency services, and therefore have the best accessibility, and a higher chance for the safety of its residents. We can then overlay bus stop locations to determine the assisted living residences with the most number of bus stops within walking distance, and use it to estimate the assisted living residences with the best access to public transport. We can then overlay crime data with the locations of assisted living residences to find the number of incidents of break-and-enter crimes within the last five years that are within 300m of each residence to act as a measure for the prevalence of crime in each area.
Through this, we can then suggest the best assisted living residences. This information will be useful for people considering assisted living residences, as safety and accessibility is a huge factor when assessing suitability of a residence. Information on accessibility to public transport is also important as much of the elderly population may not have access to a means of private transport.
Methodology
Acquire
Project data was collected from various sources outlined in figure 1. Crime, first responders, landuse, bus stop and cartographic boundary data were available as SHP datasets. However, data on the location of hospitals was only available as tabular data, and data on the location of assisted living residences was only available as a list in a registrar with basic info of name and address. We therefore geocoded the addresses to create shapefile datasets of hospitals and assisted living residences.
The road network data file was produced by our TA, Peter Whitman, and we were allowed to use it with his permission.
Parse Filter
The ‘Landuse2011’ layer provided us with our desired project area boundary when we selected by attribute: ‘municipality = City of Vancouver’, however it also included many vector polygons to illustrate buildings, which we did not need. We therefore exported the ‘City of Vancouver’ attribute selection as a new layer, and clipped the ‘lpr_00b16a’ BC provincial map layer with it, to create our simplified project area boundary, named ‘Project_area’.
We then clipped the ‘hospitals_point’, ‘crime_shp_all_years’, ‘stops_shp’, ‘FRST_RSPND_point’ and ‘Assisted_living_residences’ SHP layers using the ‘Project_area’ layer to remove unnecessary data.
To select crimes that were relevant towards the safety of potential residents in an assisted living residence, we selected only ‘break and enter residential/other’ crimes that occured after 2013. This allowed us to consider crimes that only occurred relatively recently (within the last 5 years), and also removed the significance of crimes such as ‘theft of bicycle’ and ‘vehicle collisions’, which we thought would not correctly represent the prevalence of crime in the area that most concerned potential residents.
Lastly, separated our data layer on first responders to specify locations of police stations and fire stations by selecting by attribute: ‘response group = fire station’ and ‘response group = police station’, and exporting each as a new layer accordingly.
Mine
To determine the assisted living residences which had the best accessibility to emergency services (hospitals, fire stations, police stations), we used the ‘generate closest facility’ function for each of the separate layers based on the road network dataset. The closest route between each assisted living residence to the respective emergency service was then drawn with data on the distance of each journey.
To determine the prevalence of crime in the areas of each assisted living residence, we created a buffer of 300m around each residence, to represent their effective vicinities, and intersected these with our selected ‘crime’ data layer. This allowed us to count the number of crime incidents which occurred in the area of each residence, and we used this as an indicator for the prevalence of crime. Our buffer distance was determined by what we believed to be the ‘effective vicinity’ of each assisted living residence, which was 300m. Any larger, and the buffer may have accounted for crimes in a separate neighbourhood.
To determine the assisted living residences’ access to public transport, we created a buffer of 381m around each of them and intersected this with the ‘bus stop’ data layer. This allowed us to count the number of bus stops within the buffer, and we used this to measure accessibility to public transport. Our buffer distance was determined by the distance covered by a 5 minute walk at the average gait of an elderly woman in her 70s (1.27m/s).
Represent
To represent the data on access to emergency services, we created a map showing the shortest routes of each assisted living residence to the closest hospital, police station and fire station, colour coding the routes to be unique for each assisted living residence. This gave the user a general idea of the varying distances, however, it was still difficult to determine exactly which assisted living residence had the shortest routes at first glance. For this reason, this map will be supplemented with a table with data on the shortest routes to each emergency service.
To represent the data on access to public transport, we created a map showing the buffers of 381m around each assisted living residence and colour coded them. Buffered areas with darker colours illustrated residences with more bus stops located within the 381m buffer.
To represent data on the prevalence of crime, we created a map similar to this, colour coding the buffer areas. Buffered areas with darker colours illustrated residences with more incidents of crime within the 300m buffer.
Table of dataset (figure 1):
| Layer / datafile name | Source | Uses | Entity / data model | Attributes | Modifications |
| ‘Landuse 2011’ | Metro Vancouver Open Data Catalogue,
April 2018, ‘2011 Generalized Land Use Classification’ |
Map of BC | Polygon | Name, municipality, purpose, description and area of land | Select by ‘municipality = City of Vancouver’ to create project area |
| ‘Lpr_ 00b16a_e’ | Abacus Dataverse Network,
April 2018, ‘Cartographic Boundary files census year 2016’ |
Map of BC | Polygon | Name and area of Province | Clip to project area |
| ‘Hospitals _point’ | BC Data Catalogue,
April 2018, ‘BC Health Care Facilities (hospital)’ |
Location of hospitals | Points | Name, address, contact info, website and description of hospital | Clip to project area |
| ‘Crime_ shp_ all_years’ | City of Vancouver,
April 2018, ‘Crime (SHP)’ |
Location of incidents of crime | Points | Type, date and address of incident of crime | Clip to project area
Select by ‘Type = ‘break-and-enter residential/other AND year >= 2013’ |
| ‘FRST_ RSPND _point’ | BC Data Catalogue,
April 2018, ‘First Responders’ |
Location of police, ambulance and fire facilities | Points | Address, contact info, description, type and business category of first responders | Clip to project area
Select by ‘response_group = fire station’, export as new data layer. Select by ‘response_group = police station’, export as new data layer |
| List of assisted living residences | BC Health,
April 2018, ‘Assisted Living Registrar’ |
Location of assisted living residences | Text | Address, contact info, type (subsidized or private-pay) of assisted living residence | Geocode address to find location as shapefile
Clip to project area |
| ‘Stops_ shp’ | Abacus Dataverse Network,
April 2018, ‘Translink Transit GIS Data’ |
Location of bus stops | Points | Address, stop name, stop description | Clip to project area |
| Roads Network_ND | Peter Whitman (TA),
April 2018, Road network dataset |
Location, length, direction of roads and junctions | Vector points, lines, network dataset | Location, length, road ID of roads and junctions | NA |
Discussion and Results
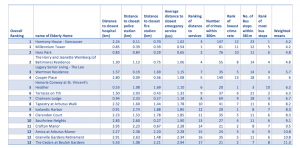
Figure 2: Overall Rankings of Assisted Living Residences in Vancouver
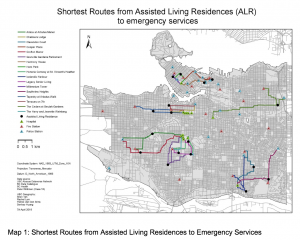
After interviewing 10 elderly citizens from the Vancouver area we concluded that living close to emergency services was the most important variable elderly citizens took into consideration when deciding on where to live. We believe this to be the case because when people age their ability to take care of themselves decreases and thus their reliance on emergency services grows. As a result, the data in which we gained from this map was of the utmost importance. This map, which locates the nearest hospital, fire station and police station to each of Vancouver’s 17 assisted living residences, depicts the shortest routes to each of these services from each assisted living residence based upon our given road network dataset. While difficult to pinpoint the exact distance and discern which assisted living residence is closest to these services by strictly looking at the map, it is clear that the assisted living residences located in Vancouver’s downtown core such as Millennium Tower and Haro Park are nearest to these emergency services.
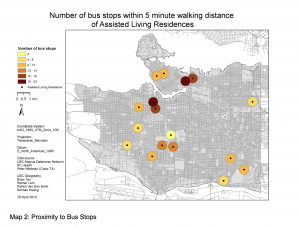
Map 2 depicts the number of bus stops within a 381m radius of each assisted living residence. This buffer zone was determined by the distance covered over a 5-minute walk by a woman in her 70’s moving at a rate 1.27m/s, to which we assumed would be a reasonable distance to classify these bus stops as being nearby. As people increase in age, their eyesight naturally worsens while their body is simply not able to function in the same ways it once did. As a result, the ability to drive a car is not something that many elderly citizens living in assisted living residences can rely upon as a form of transportation, thus their reliance on public transportation increases. Map 2 depicts the assisted living residences of Harmony House and Terraces on 7th to be the most suited for elderly citizens who rely upon public transportation as way to move around.
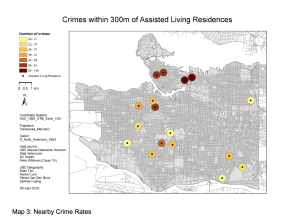
Map 3 depicts the number of residential break and enter crimes which have occurred within a 300m radius of each assisted living residence in Vancouver since 2013. We chose to represent residential break and enter crimes because we believed they would have the most direct impact on those living in assisted living residences. The map clearly details the residences of Cooper Place and Harmony House to be the worst in terms of the prevalence of break and enter crimes, while all assisted living residences located within Vancouver’s downtown core were ranked near the bottom. Generally, the assisted living residences located furthest away from Vancouver’s downtown core such as Icelandic Harbour, located just across the Fraser River from Richmond, seemed to have fewer incidents of crime.
While each map is individually important, by analysing all three together, certain trends become apparent with regards to Vancouver’s assisted living residences. Vancouver’s downtown core tends to have the shortest routes to emergency services, the best access to public transport, but unfortunately, also the highest numbers of crime incidents, which may be attributed to the high density of Downtown Vancouver. The safest areas to live in are low-density areas such as in Kerrisdale or near Richmond, however these areas tend to also be further from emergency services, and have less access to public transport.
The best assisted living residences would ideally have a balance of these three factors, however our results show that at least one of these factors are sacrificed in a tradeoff. To determine the best residence, we therefore decided to use a ‘weighted mean’ method, assigning a different value of importance to each factor to aid us in determining superiority. Each assisted living residence was given a ranking for their distance to emergency services, accessibility to public transport, and prevalence of crime (‘1’ being the best, ‘17’ being the worst). As there were three emergency services (hospitals, fire stations, police stations), we decided to calculate the average distance to emergency services, and use that single value to calculate the rank for ‘distance to emergency services’.
To decide on the weight and importance of each of these categories, we conducted a small survey on 10 elderly people to represent our sample. We concluded that the distance to emergency services was the most important variable, followed by the accessibility of the residence to public transport, with prevalence of crime being the least important factor. As a result, in our final rankings, distance to emergency services constituted 50% of the overall score, while accessibility to public transport and prevalence of crime comprised the other 30% and 20% respectively. This overall ranking was calculated by:
(Ranking of distance to emergency services) (0.5)
+
(Ranking of accessibility to public transport) (0.3)
+
(Ranking of prevalence of crime) (0.2)
The assisted living residence which scored the smallest value following this calculation represented the most desirable, while the assisted living residence in which scored the highest number was the least desirable. See figure 2 for a complete list of these rankings.
We concluded that the Harmony House and Millennium Tower assisted living residences were the most attractive based on our criteria, and contrastingly, the Cedars at Beulah Gardens elderly home was the least desirable location to live. These rankings are, however, based on the relative importance that we assigned to each factor through our weighted mean method of analysis, and so may not represent the best residence for a person who emphasizes more importance on the prevalence of crime in the vicinity of a residence. For those considering assisted living residences, we highlight that our ranking should not be used alone, but supplemented by a consideration of each factor to decide which is the most suitable residence.
Error and Uncertainty
As is the case in all GIS analysis certain forms of error and uncertainty are present and unavoidable. Distortion is inevitable when projecting the world onto a 2-D map. The maps for our project were projected using the Transverse Mercator projection which is optimal when projecting an area in a specific UTM zone, which in our case was zone 10. Nerveless as the Transverse Mercator projection just like other projection systems works by flattening out the world slight distortion of the geographical features is present. However, because the UTM zones in which the Transverse Mercator projection projects are relatively narrow this distortion can be ignored for our project but must still be noted as being present.
Furthermore, obtaining access to perfectly accurate real-time data is nearly impossible in our ever-changing world. For example, the data for our land use layer was last updated in December of 2016, while the data for our hospitals layer was last updated in November of 2017. While these updates were done relatively recently the possibility for changes in the data which would change the outcome of our maps and results is always a possibility for error.
With regards to calculating the preferences of elderly citizens, due to a lack of time and resources we only managed to interview 10. As a result, our sample size is most likely to be too small while potentially not actually reflecting the true preferences of Vancouver’s entire elderly population. Because of this small size our data has a greater possibility of being skewed and by only interviewing 10 elderly citizens each person’s preferences holds a far greater value based on percentage than if we had the time to interview 100 or even 1000 elderly citizens.
For our project we only selected ‘break and enter residential/other’ crimes that occurred after 2013. However, this can create uncertainty amongst our audience as not all crimes represent the situation of specific area, as certain crimes may be isolated instances while not dictating what crime rates will be like in the future. For the purpose of our project we are safely assuming that areas with a history of high crime rates in the past will have high crime rates in the future. Furthermore, our selection to only map break and enter crimes may create uncertainty amongst our audience as some might view petty crimes, such as bike thefts, as being significant and thus should have been included in our report.
In addition, we use a 381m buffer to represent the distance from bus stops to assisted living residences. However, this is only an aerial view buffer and does not follow actual roads. This buffer is merely a straight line from the assisted living residence to the bus stop to calculate walking distance. Due to different walking speeds and the potential for walking inconvenience, such as a lack of crosswalks nearby. It may in fact take longer than 5 minutes to walk from certain assisted living residences to certain bus stops.
Lastly our project only considers the best assisted living residences in Vancouver based on safety and accessibility to public transportation. To some this may not be a good reference on deciding where to live based on variables in which we did not consider such as nearby grocery stores, entertainment or recreation facilities. While we agree that quality of life is just as important as essential services, we elected to focus on the essential “life or death” facilities.
Further Research/recommendations
To further our findings in the future, projects could include more in-depth information about other crimes such as ‘bike theft’ or ‘homicide’, as those crimes may be considered important for people when deciding on the safety of a residence. Instead of just focusing on one specific type of crime as we have done, we recommend to cover more of them to satisfy a wider audience.
When conducting analysis on the bus stops within walking distance, we would also recommend to conduct an analysis in terms of distance by roads as opposed to an aerial distance from the central point. In this way, we would be able to produce more accurate results as an analysis using an aerial, radial distance from a central point means that we are assuming there are no obstacles in the way, but that is usually not the case in real life.
Future research could also include data on the locations of essential services such as grocery stores and areas for recreational activities such as green spaces, parks, and community centres. These are also important for determining the quality of life, and is not solely based on the access to public transport and safety of the location.
Meanwhile, although the distance to emergency services is one way to measure safety, the quality of training in life-saving skills for assisted living residence employees is also a huge factor. Future analysis could be conducted on the proficiency and training of residence workers if data becomes available in the future.
Overall, this project is a general indicator of the quality of an assisted living residence based on safety and accessibility, but it is just the first step. Further research needs to be done to support our findings and to more comprehensively determine the best assisted living residence in Vancouver.