Lab 3: Planning for Storm Surge- Thoughts and Maps
Given the geological and climate change weather events that have transpired recently around the world, including recently in Tofino on Vancouver Island with the waves and flooding, I have created a series of maps that highlight the areas in the Metro Vancouver that are at risk to flooding or a storm surge.
The aim of the project is to find the immediate danger zone within Vancouver. This can help better prepare to plan for the future if storm is to happen and prevent the loss of lives.
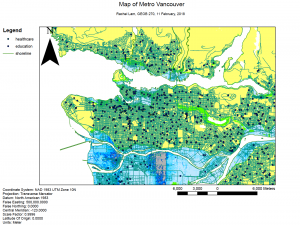
The maps below illustrate the area which is most prone to flooding and area which are safe. Yellow is the area of high elevation and blue is area of low elevation. As seen from the map most of Vancouver, Burnaby, North Vancouver and West Vancouver is in high elevation zone, thus save form the flood but Richmond is completely flooded. From this we know more flood precaution measures needs to be taken in Richmond. I also included location of health care services and education institute, because these are services vulnerable to any hazard. Health care services like Hospital and Clinics have patients that are clumsy to move. Education institute have schools and sometimes have young kids whom might get scared easily. The aim is to plan ahead and plan around these facilities to mitigate the potential danger.
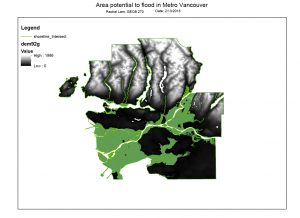
The second map have no interest point, but instead show a clear view of the elevation of Vancouver. Area in green are areas which are prone to flooding and as I just mentioned, Richmond is very liking to flood.
This lab is challenging in several ways:
- I need to think of ways, color to best represent high and low elevation. If I make blue the high elevation and yellow to be low elevation, it might create confusion. Defeating the whole purpose of the map to express which area will be flooded and which won’t.
- Sometimes when I attempt to make changes of the map it changed the whole map completely
- How zoom in or out the map should be, should I include the whole of Richmond or not?
What I learnt from this lab:
- To be very patient.
- Colour representation is more important than you think. Wrong colour = Wrong message being sent to readers.
- Learnt to utilize spatial and tabular datasets to create a map that displayed areas of Vancouver that would be at risk if a flood were to occur.
- Learnt how to “select by location” which is super helpful because the list is so long, if I were to look for each of them, it would be impossible.