COMM 464

#CondomEmoji

No, the title of this blog post wasn’t a mistake.

I came across a campaign by Durex Condoms to get a condom emoji created and included in the official emoji “library”, which is managed by The Unicode Consortium. Durex’s goal is to have the condom emoji incorporated by December 1, World AIDS Day. The rationale is: people use other emojis to suggest sexual activity all the time (eggplants, hot dogs, doughnuts, birds, bees, etc), so why not just create an emoji that gets straight to the point? The campaign is appropriately accompanied by a hashtag, #CondomEmoji, and a promotional video.

I personally find this campaign hilarious and wonderful. It’s a great marketing move on their part, especially using social media and pop culture to spread the message. At the same time, the use of a condom emoji may actually communicate explicitly that a condom will be used during the “activity”, which could reduce STIs and the like. Social benefit! Okay, that may have been a bit of a stretch.

Emojis have become such a prime element of our communications (at least, for millennials). They add humour and brevity to our messages; celebrities use them all the time (Hillary Clinton too, although it kind of backfired on her…), and Oxford even named an emoji as Word of the Year for the first time ever! So, why not create an emoji to spread a positive message?

durex ad

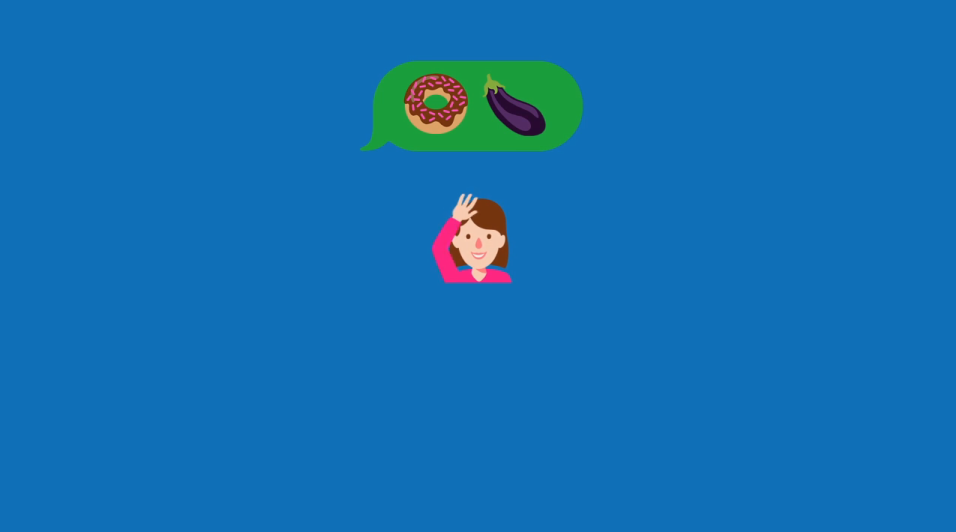
Forget doughnuts and eggplants… we need a #CondomEmoji, says Durex

In class, we have talked about integrated digital communications, various digital & social media platforms, analytics, the fast-paced world of social, and more. I think this Durex campaign perfectly summarized what a successful campaign could look like, with all the right tools and metrics in place. I’ll definitely be checking at the next Unicode update for a #CondomEmoji!

References:

  • Powell, C. (2015, November 19). Durex calls for condom emoji in new global campaign. Retrieved from http://www.marketingmag.ca/brands/durex-calls-for-condom-emoji-in-new-global-campaign-162006
  • Various authors. (n.d.). #condomemoji hashtag on Twitter. Retrieved from https://twitter.com/hashtag/condomemoji
  • Alvarez, E. (2015, November 19). Durex thinks a condom emoji can help promote safe sex. Retrieved from http://www.engadget.com/2015/11/19/durex-condom-emoji/
  • Oxford University Press. (2015, November 16). Oxford Dictionaries Word of the Year 2015 is… | OxfordWords blog. Retrieved from http://blog.oxforddictionaries.com/2015/11/word-of-the-year-2015-emoji/

Tweens & Teens’ Social Media Use: Off the Charts

I came across a new report this week by Common Sense Media, a site that “improves the lives of kids and families by providing independent reviews, age ratings, & other information about all types of media”. The report unveiled some striking statistics on consumption of social media by tweens (aged 7-12) and teens (aged 13-18). Here are some figures that I found most surprising:

  • Teens use an average of 9 hours of entertainment media per day, and Tweens use an average of 6 hours per day. This does not include time spent on homework-related activities.
  • TV and music are still dominant, and social media = #meh. Of Teens, 66% listen to music every day, and  58% watch TV. Of Tweens, 62% watch TV every day and 37% listen to music. Only 10% of Teens choose social media as their “favourite” media-related activity.
  • Many Teens use media while studying, and most think it has no effect on the quality of their work.

sm report consumption

sm report tv & music

sm report multitasking

All images from Common Sense Media.

Now… what do I think about this? Yes, the numbers are shocking. Yes, I think my generation and the next will probably suffer from issues related to eyesight, physical posture, even maybe chronic headaches and the like. But it is so difficult to find an appropriate level of consumption in our transition to a more digital world. From my own observation, we began to transition to digital not only because it was “cool”, but because it was first rooted in an environmentally-friendly mandate. By changing more of our textbooks, games, and learning tools to an online platform, it was meant to reduce industrial waste (paper and other stationery). But perhaps we’ve gone too far. For parents, it is easy to hand your kid a tablet instead of carrying several books or games on-the go. The convenience of the digital age is elevating our standards for content on-demand (we want it now!), and in tween & teens’ impressionable lives, it makes a big impact.

As difficult as it may be, I think it is possible to strike a balance between our lives both online and offline. For example, parents could enforce stricter guidelines for digital media use, and partake in activities with their kids outdoors.

One thing that is evident is the plain fact that our lives are becoming more digital, whether we like it or not. The challenge is in maintaining our “human” side.

References:

  • Robb, M. (2015, November 2). Tweens, Teens, and Screens: What Our New Research Uncovers. Retrieved from https://www.commonsensemedia.org/blog/tweens-teens-and-screens-what-our-new-research-uncovers
  • Common Sense Media. (2015). Media Use by Tweens and Teens: Infographic | Common Sense Media. Retrieved from https://www.commonsensemedia.org/the-common-sense-census-media-use-by-tweens-and-teens-infographic

Google Analytics: A Tool For Success

This week, we discussed Google Analytics and all the awesome insights we can gain from running a few simple reports. In class, we were first direct to this article as a starting point to see some custom reports already out there, created by experts.

One report that caught my eye was the Content/Page Efficiency Report by Avinash Kaushik, which can help answer questions such as: Which content is most engaging? Which subject matter experts should we hire more of? What type of content (videos, demos, pictures, reviews etc.) do visitors value more? 

page efficiency custom report long tail keyword segments

Sample of output from Avinash’s Content Efficiency Report. Image from Kaushik.net.

After looking at this tool, I thought it would be especially relevant for our client, BroadbandTV. After our initial meeting, BBTV made it clear that they are trying to target millennials (people like me!) and they are investigating what type of content will best attract our attention. Many of their Partners are also millennials, so in addition to appealing to a general audience, this millennial-geared content would also apply to their Partners (the actual source of BBTV’s revenue). We could assist with creating posts on the BBTV Blog, which regularly produces content. By using the Content/Page Efficiency Report, it could reveal what type of content appeals most to their Partners on BBTV’s blog (tutorials, Partner features, etc), and what type of content they should produce more of.

I look forward to bringing up these suggestions to our client, and working with them to boost their social media presence in the world of multi-channel networks, a young & somewhat complex industry.

References:

  • Kissmetrics. (n.d.). 12 Awesome Custom Google Analytics Reports Created by the Experts. Retrieved from https://blog.kissmetrics.com/expert-google-analytics-reports/
  • Avinash. (2011, August 7). Produce Actionable Insights: Mate Custom Reports With Adv Segments! Retrieved from http://www.kaushik.net/avinash/actionable-web-analytics-custom-reports-advanced-segments/

Diversity in Digital Media

I came across a few really interesting articles this week, concerning racial and gender diversity in digital media & tech companies. The first article highlighted BuzzFeed — our favourite outlet for random facts, celebrity quizzes, and “WTF” news — and highlighted that it had caught up to The Washington Post in terms of racial diversity. This week, BuzzFeed released numbers on the diversity of their workforce. Some highlights include:

  • BuzzFeed’s newsroom has gone from 75% White employees down to 69%
  • The percentage of female managers at BuzzFeed increased from 52% to 58%, making women the “dominant gender” in BuzzFeed’s managerial positions
  • Asian-Americans make up about 12% of the employees working on both editorial and branded content for BuzzFeed Motion Pictures


Images from BuzzFeed.

You may be thinking, “But this sounds like an HR problem. Why are you writing about it??”

In our marketing classes, we learn that all activities of the business can contribute to brand image, from finance to operations to CSR. So, even if it’s an HR matter, diversity in the workplace (especially when openly disclosed, as in BuzzFeed’s case) can make a difference in the way people perceive a company.

International Business Times did a report earlier this year that compared various media companies (digital and traditional) on their diversity in the workforce. Traditional media companies (Washington Post, Newsday, Houston Chronicle, New York Times, etc) seem to be just as diverse, if not more, than new-age digital media companies (BuzzFeed, Mic, International Business Times, etc). However, one main issue was that many of these companies do not even publish their diversity numbers!

diversity in media companies

Image from International Business Times.

As firms increasingly recognize that top talent can lie outside of the “regular ol’ pool” of applicants (ie. white males), I anticipate that this should become more of a priority for companies to balance out racial and gender diversity, and show off how diverse their workforce is. In the words of so many companies nowadays, “Diversity in the workforce is just good business.”

References:

  • James, B. (2015, October 20). BuzzFeed’s New Diversity Numbers Show Digital Media Giant Has Caught Up With The Washington Post. Retrieved from http://www.ibtimes.com/buzzfeeds-new-diversity-numbers-show-digital-media-giant-has-caught-washington-post-2149176
  • Peretti, J. (2015, October 20). How Diverse is BuzzFeed in 2015? Retrieved from http://www.buzzfeed.com/jonah/diversityatbuzzfeed2015#.ebZQdo6KxZ
  • James, B. (2015, August 17). How White And Male Are Digital Newsrooms? New Media’s Old Diversity Problem. Retrieved from http://www.ibtimes.com/how-white-male-are-digital-newsrooms-new-medias-old-diversity-problem-2056843

Paid vs. Earned Media: Which Prevails?

This week, we discussed Paid, Owned, and Earned media. In particular, I remember the quote “Earned is King, Owned is Queen, Paid is Jester“. In this post, I will discuss an article & video I came across (Who’s Winning the Battle Between Paid and Earned Media?) that helped me make the connections between all these different types of media in the digital marketing world.

This quote stuck with me in particular: “content an audience willingly watches should not be equated to content audiences avoids.” This is referring to earned (the former) vs. paid (the latter) media – in today’s world, there are AdBlockers galore, which prevent consumers from seeing certain marketing messages. But, there is also Buzzfeed article upon Buzzfeed article that indirectly markets to consumers (topics including Disney princesses, 90’s TV shows, the best hamburgers, and more…). So which channels should we invest marketing dollars into?

What the author and Sarah Hofstetter (the woman in the video) are saying is that it’s more and more difficult the quantify a company’s impact because of the blurred lines between revenue generated from paid and earned media (Did the consumer click on the ad because it showed up on their Facebook sidebar? Did they specifically seek out the product because it was part of an EliteDaily article?) The authors suggest that here should be a balance between the two, instead of choosing one exclusively; because they work alongside each other.

As much as marketing is a quantifiable business activity, the prevalence of earned media is complicating the measurability of social media’s impact. I think that is generally a good problem to have; nonetheless, there needs to be some way to measure the activities of earned media in order to make future marketing projections more accurate.

References:

  • Skid, N., & Hall, D. (2015, October 7). Who’s Winning the Battle Between Paid and Earned Media? Retrieved from http://adage.com/article/digital-crash-course/earning/300795/


Email Marketing: Some Surprising Stats

In this post, I want to discuss an article referred to us in class (Email marketing statistics 2015 compilation), about some email statistics for 2015: observations I find justified, interesting, and surprising.

What I find justified to the current digital marketing environment is that the Lodging, Travel Agencies & Services industry had the highest unique open rate (among larger businesses). As a lover of travel myself, I will actually open emails from large travel companies because they usually contain pretty good deals. Since they asked for information such as my date of birth and when I signed up on the site, I can tell the email message was tailored to someone like me, with emails to tropical destinations coming a few weeks before Reading Break.

The Lodging, Travel Agencies & Services industry has the highest unique open rate for large businesses.

One interesting statistic I saw was the exponential growth in mobile and tablet opens. I knew these platforms had been gaining popularity, and I increasingly found myself opening up emails on my own mobile device. But what I found most interesting was that mobile and tablet opens had increased 500% from four years ago. Now, nearly half of all emails are opened on either a mobile device or tablet!

Email statistics 2011 to 2015

Email opens on mobile and tablets increased 500% in the last four years!

The statistic that surprised me the most was that the Daily Deals / E-Coupon industry had the lowest open rate, at 13.9%! (for small & medium-sized businesses) I first thought, “but isn’t that the reason people even subscribe to these types of emails, to get informed on when there are deals?” Although when I reflected on my own experiences with sites such as Groupon and Red Pocket, I had actually unsubscribed to them because I found them to be too frequent and annoying. Perhaps this is what happened here.

The 10 worst-performing email industries for small & medium-sized businesses

Overall, the world of email marketing is complex. I get spammed on the daily from companies trying to sell me products and services. In fact, I find myself ignoring most of them! The ones that really catch my attention are the ones with catchy subject lines, which is something we learned in class. I am looking forward to learning more about email marketing this semeseter!

References:

  • Chaffey, D. (2015, August). Email marketing statistics 2015 compilation. Retrieved from http://www.smartinsights.com/email-marketing/email-communications-strategy/statistics-sources-for-email-marketing/
  • All images also from the above source.

Google Adwords: A Whole New World

One primary reason I took the course COMM464 was to learn more about SEO, analytics, and the general quantifiability of social media & internet-based marketing. Although there is more to be explored, I learned a great deal from this week’s lecture, notably with Google AdWords.

I am amazed at the subtleties of AdWords, the fact that a simple “…” or modifying the tense of a verb can radically change success rates. That being said, of course I had to search up some “Google AdWords hacks” to see what other tricks are out there. To my dismay, the information I found was very general. I suppose if marketers had a truly remarkable AdWords hack, they would keep it to themselves and not expose it for the world to use. Nonetheless, I did find some interesting tips:

  • Using Gmail ads: Instead of ads on the right-hand side of the Gmail browser, ads are also available right in the inbox above the subject line. Even if people do not click, these ads are directly in users’ line of vision.
  • “Write Insane Ads that Appeal to Emotions”: One site recommends publishing ads with wording that appeals to emotions. This entails really getting to know your customers and finding out details such as: what/who do they love/hate? what is their biggest problem and why are you the one to solve it? One author calls these “Unicorn Ads”:
    • example:ppc-marketing-hacks-ad-writing-tips
  • Purposely use misspellings: One author encourages using misspelled words in order to “get hits before the real ads”. Apparently, it’s cheaper too.

These are just a few examples of creative tactics being developed to make certain ads stand out above others. Although some seem bizarre, it’s no surprise to me that they exist, given the competitive nature of PPC ads. I am excited to attempt some of the tactics we learned in class, and through my own personal research, to our clients in COMM464!

References:

  • Patel, N. (2015, August 15). 8 Google AdWords Hacks That’ll Double Your Conversion Rate. Retrieved October 1, 2015, from http://neilpatel.com/2015/08/15/8-techniques-thatll-double-your-google-adwords-conversion-rate/
  • Kim, L. (2014, September 30). The Top 10 Best PPC Hacks … Ever! Retrieved October 1, 2015, from http://www.wordstream.com/blog/ws/2014/09/30/adwords-hacks
  • StankDawg. (n.d.). Hacking Google AdWords. Retrieved October 1, 2015, from https://www.defcon.org/images/defcon-13/dc13-presentations/DC_13-Stankdawg.pdf

User Experience: Not Always A Necessity

This week in class we saw some examples of user experience: the good, the less-good, the downright ugly. After Meena shared the article “10 UX Design Trends You Shouldn’t Overlook in 2015“, I started to think that user experience (UX) was the most vital component of internet-based marketing, and that all websites and online platforms needed to be “pretty” in order to be successful. While an aesthetically pleasing site can influence users’ attitudes towards a specific company — a halo effect, in my opinion — it definitely does not dictate, or show a causal relationship, to company success (exception: design/creative-heavy industries).

Allow me to illustrate one example I came across recently. In another UBC course I am taking, Mergers & Acquisitions, one case study spoke of Berkshire Hathaway, an American multinational conglomerate holding company involved in diversified industries such as insurance (GEICO), retail (The Pampered Chef), clothing (Russell), and more. Warren Buffet is the current Chairman, President, and CEO of this massive company, and Berkshire Hathaway has experienced a compounded annual growth rate of 19.7% each year from 1965-2013. Talk about a success story.

But take a look at a screenshot of their current website.

Berkshire Hathaway website

“WHAT???” was instinctively my first reaction. I thought: “This doesn’t look like a market-leading conglomerate, it looks more like they finally realized it was past 1995 and that their website should be updated to include a fancy GEICO logo”. I found this quite hilarious actually.

This example slapped me with the “divide” between functionality and design. Although UX usually wants to incorporate both, in some cases it’s probably not necessary to have a perfect balance. In COMM464, I am looking forward to exploring and learning more about UX!

References

  • Yadav, A. (2015, February 25). 10 UX Design Trends You Shouldn’t Overlook in 2015 – Usability Geek. Retrieved September 24, 2015, from http://usabilitygeek.com/10-ux-design-trends-2015/
  • BERKSHIRE HATHAWAY INC. (n.d.). Retrieved September 24, 2015, from http://www.berkshirehathaway.com/
  • Berkshire Hathaway. (2013). Berkshire’s Corporate Performance vs. the S&P 500. Retrieved October 4, 2015, from http://www.berkshirehathaway.com/letters/2013ltr.pdf

Snapchat Ads: The Ultimate Challenge for Advertisers

This week, we saw an overview of currently popular social media platforms and learned a bit about them. We discussed in class that Snapchat incorporated advertising into the app faster than many other platforms. This fact particularly interested me because with all the available marketing channels out there, what would prompt a brand to advertise through a mobile-only platform like Snapchat? Who actually watches the ads?

I read a great article summing up the great challenge that advertisers face if they are to engage in Snapchat advertising: Snapchat viewers are quick to skip video ads if brands don’t impress. 

One shocking statistic I read in the article was “about 70 percent of users moved on by the three-second mark” for an ad. So, if a brand was buying a 10-second ad, it’s likely that users see less than half of it. A top executive at an unnamed agency explained: “… [marketers] really have to get their message out in two seconds, or else most won’t see it”.

Snapchat-snapstats

Source: Digiday

I suppose it makes sense. Most Snapchat ads are voluntary views from their millennial users. For the most part, people actually choose the “ads” they want to see, either via “Discover” (recurring news/media/lifestyle videos) or “Live Stories” (events happening around the world). With such choice among the millions of digital ads out there, why wouldn’t a user dismiss an ad if it didn’t interest them in the first two seconds?

The metric used by Snapchat to measure the success of each brand’s ad is Completion: how many ads were watched until the end? Completion “shows the level of engagement and interest”, versus views/clicks.

The future of Snapchat ads is uncertain, but so far, it looks like brands (big ones!) are adopting the fast-moving platform. Topic TBC!

References:

  • Sloane, G. (2015, September 8). Snapchat viewers are quick to skip video ads if brands don’t impress – Digiday. Retrieved September 17, 2015, from http://digiday.com/platforms/snapchat-viewers-quick-skip-video-ads-brands-dont-impress/
  • Snachat. (n.d.). Using Discover. Retrieved September 17, 2015, from https://support.snapchat.com/a/discover-how-to
  • Snapchat. (n.d.). Snapchat | Support. Retrieved September 17, 2015, from https://support.snapchat.com/ca/live-stories
  • O’Brien, J. (2015, May 21). How 6 Big Brands are Advertising on Snapchat Discover. Retrieved September 17, 2015, from https://www.sprinklr.com/social-scale-blog/big-brands-advertising-on-snapchat-discover/

Social Media: ROI?!

Many people nowadays see social media as a necessity for their businesses, especially younger professionals. But I don’t think they know why it’s so important.

Likewise, perhaps some older executives don’t believe in the power of social media and won’t give it a chance, also because they don’t know why it’s so important.

This is the primary reason I took COMM464: I want to learn how to quantify the effects of social media and eMarketing. As a Marketing and Finance student who loves branding/promotions but also values hard figures, I care about the tangibility of marketing activities.

So, I came across some articles explaining how to calculate Social Media ROI (Return On Investment). The frameworks seem fairly consistent, but I will highlight two I found useful:

How to Measure ROI in Social Media by Nick Patel (Quick Sprout):

  1. Set conversion goals
  2. Track conversions
  3. Assign monetary value to each conversion
  4. Measure total benefits by channel
  5. Determine total costs
  6. Analyze results and improve

How to Measure Social Media ROI For Your Business by Hootsuite:

  1. Connect Your Social Media ROI Back to Your Business Goals
  2. Select Social Media Analytics Tools To Measure Your ROI
  3. Calculate Your Social Media ROI
  4. Adjust to Improve

A common theme between the sources I referenced is the importance of goals in calculating social media ROI. I think this is a vital step in social media’s development, and will serve to justify the validity of social media as a primary marketing activity. I am excited to learn more about analytics and the quantifiability of social media in the coming weeks!

Sources:

  • Patel, N. (2014, June 27). How to Calculate the ROI of Your Social Media Campaigns. Retrieved September 13, 2015, from http://www.quicksprout.com/2014/06/27/how-to-calculate-the-roi-of-your-social-media-campaigns/
  • Lepage, E. (2014, April 24). How To Measure Social Media ROI For Your Business. Retrieved September 13, 2015, from http://blog.hootsuite.com/measure-social-media-roi-business/
  • Jackson, D. (2015, July 6). Ultimate Guide to Measuring Social Media ROI | Sprout Social. Retrieved September 13, 2015, from http://sproutsocial.com/insights/social-media-roi-guide/
  • Vermerin, I. (2013, November 21). 10 Ways to Prove the Value & ROI of Social Media Monitoring. Retrieved September 13, 2015, from https://www.brandwatch.com/2013/11/10-ways-to-prove-the-value-roi-of-social-media-monitoring/