This analysis uses several datasets from the Government of Yukon’s open data. The bedrock geology and glacial extent layers were both provided by the Yukon Geological Survey. The radon data, highways data and municipality outline base data were both provided by GeoYukon. The topographical layer was provided by ESRI’s ArcGis.
The first step in this analysis was to convert the radon data into csv files that could be used within ArcGIS. For the Yukon community analysis, the community radon data was then spatially joined to the municipality extent layer in order to ensure that each community had an associated radon ratio. The percentages of homes in each community with levels of radon above Health Canada limits were calculated in Microsoft Excel.
“Safe” levels of radon are determined differently depending on the organization. The World Health Organization (WHO) states that “exposure to levels exceeding 100 Bq/m3 is treated as a serious environmental problem” (Florica, 2020, p. 2655) while Health Canada defines this level as 200 Bq/m3 (Canadian Cancer Society, n.d.). For this project, I opted to use the Health Canada value as these are the regulations governing the Yukon’s management of the radon issue. Additionally, they allowed for a better overall analysis and idea of the discrepancies of the issue across each community.
The next step was to compare the bedrock geology of each community with the relative amount of radon to identify if an association can be made. I started by clipping the geology layer to the municipalities layer. Figure 1 shows an example of what the bedrock data looks like in Whitehorse. I then calculated the percentage of each rock class within each of the seven municipalities and used Microsoft Excel in order to arrange the data.
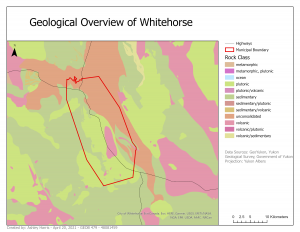
Figure 1: Example of bedrock geology data for Whitehorse.
Using the geological percentages of each community, I then completed a regression in Microsoft Excel for each rock type in order to see across the communities which rock classes appeared to be more correlated with the levels of radon exposure. As a final element of complexity, I chose to look at historical glacial extents to see if there was a pattern of communities within certain extents who also showed higher levels of radon.