
Here are some of the ways I looked at and organized the data on my first evening with it.
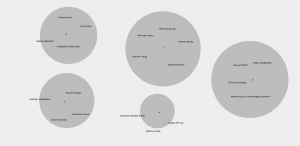
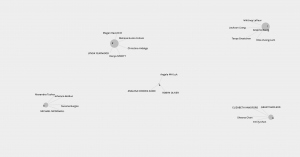
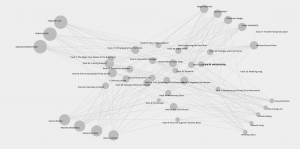
I liked seeing us broken into groups of like-minded people. This data sort made me think about how a social network platform might group us to sell our data to different marketers.
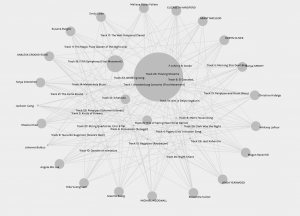
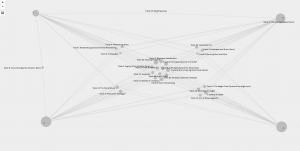
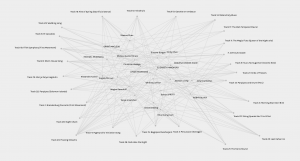
This particular visual is my favourite for looking at the actual choices and is visually more appealing than a simple bar graph or list, in that you can see the individual choices as well. It is a surprising amount of data in one image.
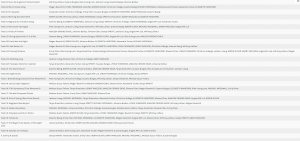
I used this list above, with a highlighter on a paper copy, to track the top the picks and who most consistently picked what the ‘group’ chose. In this way, I see that Elizabeth Hanford and Megan Ravenhill might be the best “social influencers” in our class, as they connected with the most people – in terms of strengths of their interests.
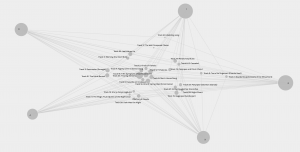
I have enjoyed this week’s task, in that I could dive into the networked web of data that was produced and see how the commonalities created “weight” for our selections and that these could be interpreted as trends. I can easily understand how my own personal data is collected and sold to advertisers and I better understand the power of ‘social influencers‘ in our society. Along this note, I have become more frustrated with advertising and located some other articles to read.
Niu et al. discuss the invasiveness of social media advertising (SMA) and note that, “Individuals engage in social media mainly to support their social interactions with others, but the appearance of SMA interrupts those goal-directed behaviors” (p. 4). The annoyance felt by the consumer can alter their perceptions of the products advertised, even though they may be the perfect audience and would normally have bought the products or services. This is where I sit most of the time and increasingly turn away from social media in my frustrated mindset. I wonder where the pendulum will swing next? Perhaps a renewed interest in paying for a platform or game to avoid the ads? Will Facebook change an annual fee for ad-free use?
Reference
Niu, X., Wang, X., & Liu, Z. (01/01/2021). When I feel invaded, I will avoid it: The effect of advertising invasiveness on consumers’ avoidance of social media advertising Elsevier. doi:10.1016/j.jretconser.2020.102320
Hi Robyn,
Reading your post I really appreciated your perspective and thought process on how you engaged with the data. The examples of the various visualizations you created were interesting to me because of how different and similar some of them were to mine. I particularly liked the communities viewed as circles as the visual representation was clear and symbolic (circle of friends/acquaintances). It made your point about social media sites grouping us more poignant to me because just like these sites there is so little information within this visualization to explain why people are grouped together. The connections seem tenuous but at the same time, they form causal relationships in a very real way as you’ve pointed out. It makes me think of how little I invest in exploring these links sometimes and how passively I accept them as they have become natural in an online world.
Thank you,
Chris