The goal of this lab was to investigate land use change in Edmonton, Alberta from 1966 to 1976 by using Fragstats to explore land and class level metrics and creating a transition matrix that visualizes the explicit change. I accomplished this lab from the perspective of an urban planning consultant hired by the City of Edmonton to monitor urban sprawl and emphasize framework for a centralized city.
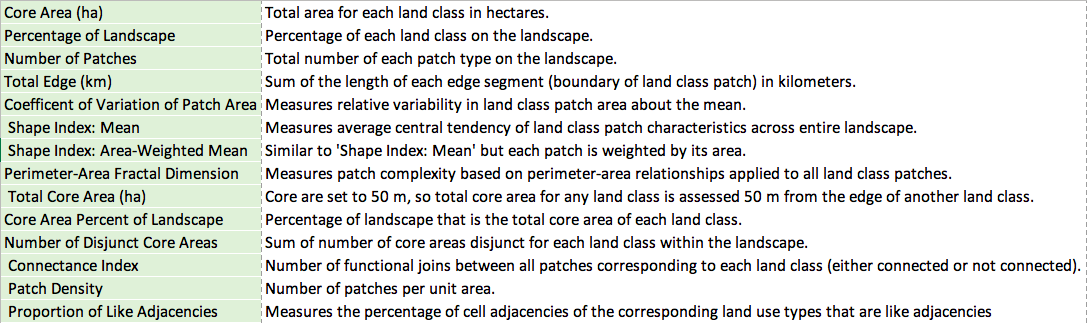
We used Canada Land Use Monitoring Program (CLUMP) data, which was derived from the development of Canada’s GIS lasting from 1966-1986, to establish the 15 different land use types. From Fragstats, the class and landscape metrics allowed us to understand exact quantitative land use change over the 10 year period. Those that are included in this analysis are described below:
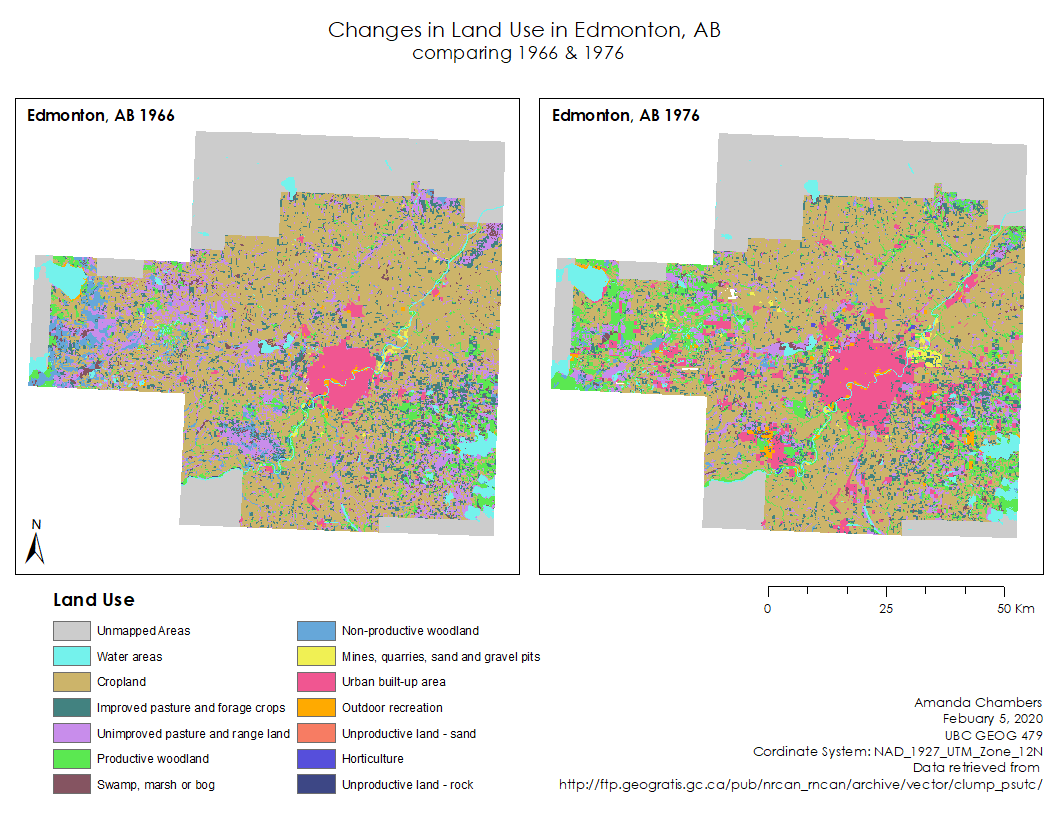
The transition matrix is essentially the map visualization, as can be seen in the map below. Urban areas increased significantly, while unimproved pasture and range land was decreased by a variety of different land use patches. Total edge length for both croplands and improved pasture and range land decreased by 2,121 km and 637 km respectively, urban built land absorbed 1818 km . This massive increase in urban built land edge length means that there is significant urban sprawl, which is confirmed by the connectance index figure, where connections between patches were halved. The urban built up area was transformed most significantly into mines, quarries, sand and gravel pits at 21%. Likewise, urban areas seem to be the greatest land use transformed into industrial use, as the percentage for industrial land size doubled. This is likely due to the dominate oil and gas industry in Alberta, as people want to live near where they work. The rate of urban expansion, in retrospect, is unsustainable, and an analysis like this could have been very valuable to centralized city planning in Edmonton and evaluating the economic/political/cultural reasons for why different land use patches increased or decreased so drastically.