The purpose of this lab was to introduce CrimeStat, a statistical software program used to analyze crime incident locations. I investigated the spatial distribution of commercial breaking and entering (B & E), residential breaking and entering, stolen vehicles, and robbery incidents in Ottawa from January 2005 to March 2006, and considered how difference in the baseline population statistics can make a large difference in the results. The analyses conducted on CrimeStat were the Nearest Neighbour Analysis, Fuzzy Mode Hot Spot Analysis, Risk Adjusted Hierarchical Clustering, and Kernel Density Estimation.
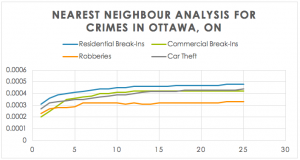
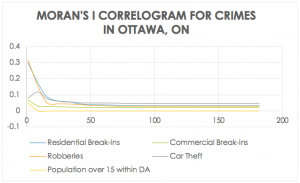
First, I used the Nearest Neighbour Analysis to determine whether the events for each crime type were clustered, and thus, spatially autocorrelated. I then compared the results to the Moran’s I results, which looks at the incidents in relation to the dissemination areas to determine spatial autocorrelation. These correlograms indicate whether the hot spots are randomly distributed, clustered, or dispersed. The more spatially aggregated neighbouring events are, the smaller the coefficient will be. So, when looking at figure 1., it shows the 1st order crimes are all very spatially aggregated, which I would expect because most crimes will hot spot in very particular places.


Next, to determine the hot spots in residential B & E data, I used the Fuzzy Mode Hot Spot Analysis to define clusters of point incidents that fall within a user defined radius, in this case, 750 meters. In the map below, we can see that some clusters have much larger frequency rates than others and that there is a fairly well defined hot spot. However, this analysis just points out clusters of crimes without creating exact areas since it just samples nearby points and leaves out higher frequency points that fall just short of 750 meters but identifies really low frequency areas that might not be of much interest. There was no normalization factor here, so it maps absolute crime volume

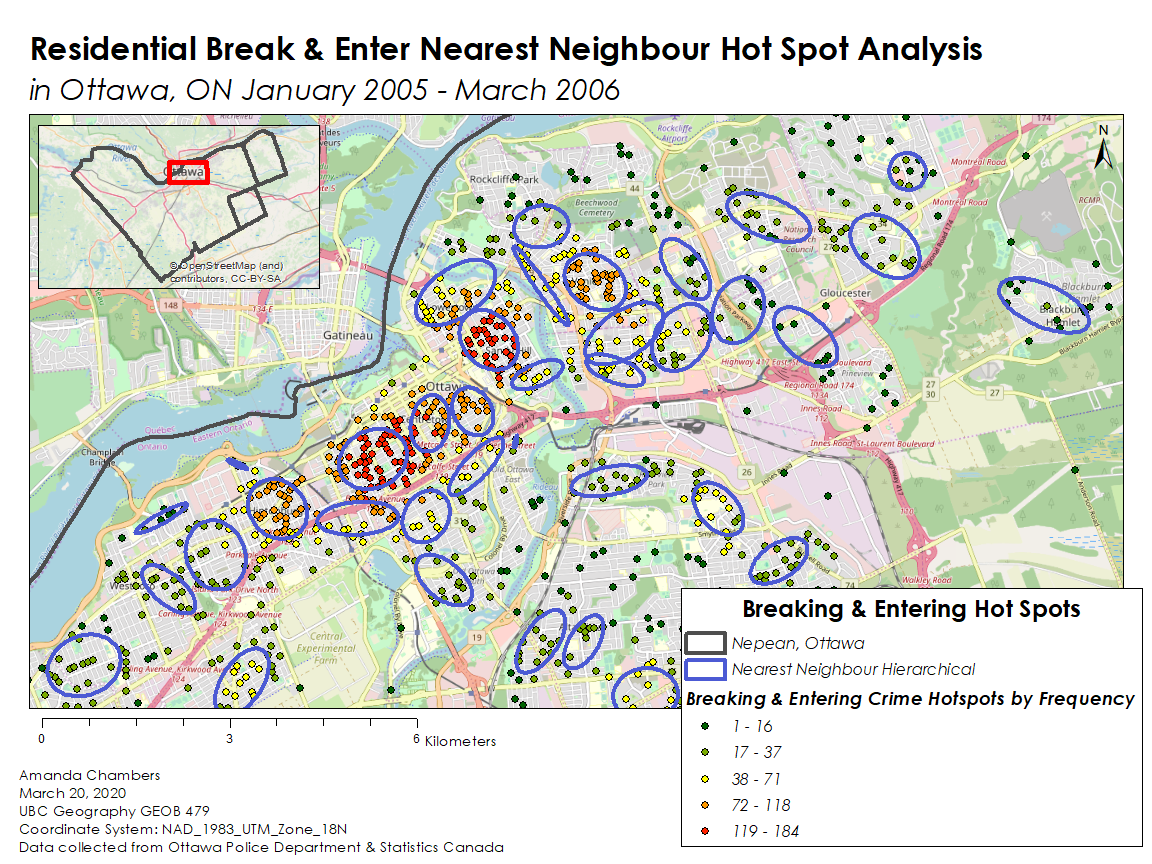
I also used the Risk-Adjusted Nearest Neighbour Hierarchical Clustering to determine hot spots, which can be seen in the map below. It produces three sets of clusters for the residential B & E points, rather than one like the fuzzy mode analysis, hence the “hierarchical” aspect. The first order cluster is quite similar to what the fuzzy mode analysis produces – localized hot spots. However, the second order cluster defines a few larger hotspots of crimes based on the first order cluster, and even further, the third order cluster defines the largest region where most crime occurs. Here, there was also a normalization variable: the total population 15 years old and above in a dissemination area, which adjusted it for risk. So, the Risk-Adjusted Nearest Neighbour Hierarchical Clustering creates ellipses based on population rates as well as residential B & E frequencies.

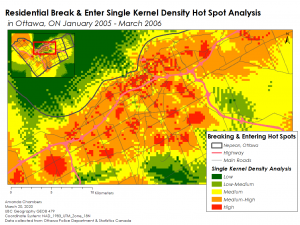
The final stage of this analysis was to produce a single and dual Kernel Density hot spot analysis. The kernel density estimation is a method for generalizing individual crimes to an entire region and to produce a raster displaying the hot and cold spot density of the crime, in this case, residential B & E. The single kernel density is applied only to the distribution of residential B & E to produce absolute densities, whereas the dual kernel density is applied to two distributions: residential B & E and a centroid each dissemination area with a summary of the crime variables used in this dataset that occurred within each DA. This means that the single kernel density estimation produces a surface showing the hot and cold spots of residential B & E across Ottawa, and the dual kernel density estimation produces a surface showing the hot and cold spots of residential B&E relative to all the other crime variables used in this dataset.
In the single kernel density estimation, the hotspots identified correspond to the ellipses identified in the nearest neighbour analyses fairly well. The same region seems to be a hot spot for residential B & E, as can be seen in the maps below. The dual kernel density estimation produces much different results, however, the map looks almost inverse from the single kernel density estimation. This shows that while most residential B & E happen on the coast of Nepean, relative to all other crimes in dissemination areas, this area is really only at medium risk, and the area of much higher risk is Cumberland, located in the Northeastern corner of Ottawa.


