The source of Life is said to spring from water, which comes in many forms. However, at the boundaries between coast and sea, when triggered by an under the sea earthquake or landslide, the great powers of water can also be destructive. The abundance of water can damage properties and infrastructures that are necessary for human activity as exemplified in the event of a Tsunami. As humans, we cannot control forces of nature, although, with the help of tools in softwares, such as ArcGIS, we can prepare for the event by taking precautionary measures.
For this example, lower mainland Vancouver, BC will be the subject of study.
Take a look at the map: Potential Risk within Tsunami Zones.
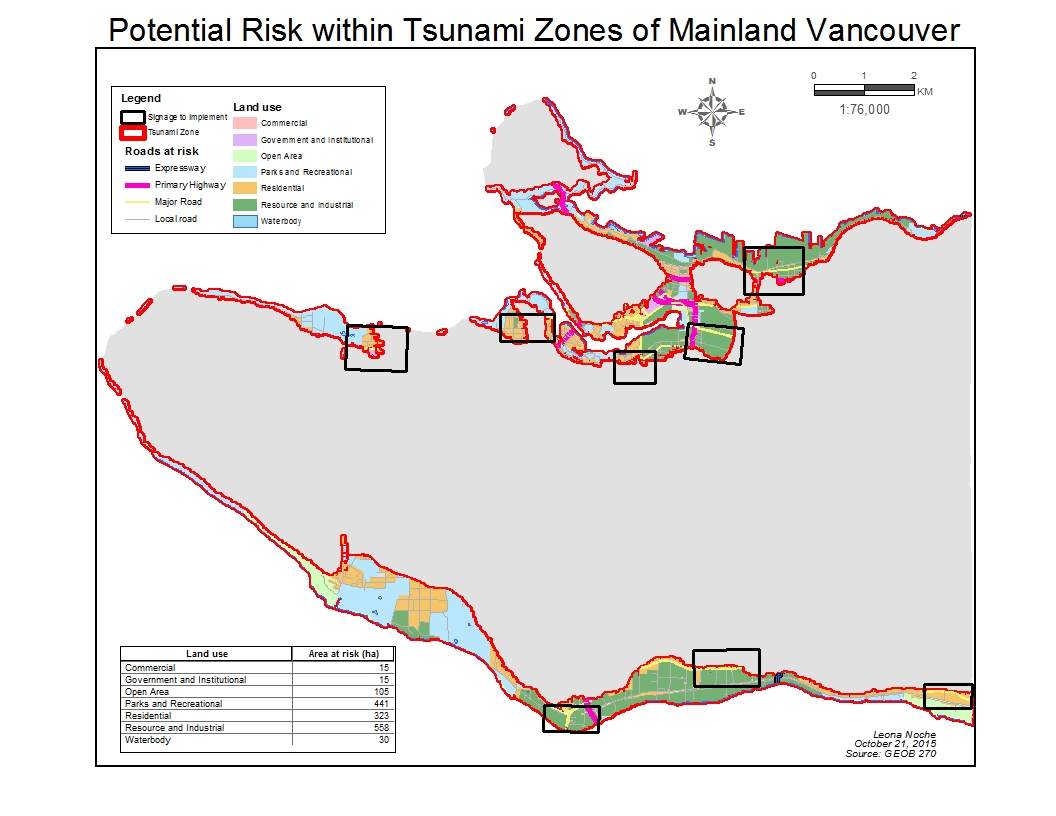
Many establishments and roads will be affected. To quantify the amount of land in danger you must learn how to create a Summary Table with the created layer with Intersect illustrating Land Use+Vancouver Danger zone. I called this layer: Van_danger_landuse. The table will allow you to use features to get the total area in potential danger, but you also need the total area of mainland Vancouver.
- In the summary table created for Van_danger_landuse, use Statistics and Sum the field that represents the area in hectares of the land use within the danger zone.
- Then, open the Attribute table to get the total area in lower mainland from the layer depicting the whole mainland (Vancouver_landuse), and use Statistics again to get the Sum.
- Be mindful that the answer for the total area will be given in meters. Thus, convert into hectares to find the percentage.
The total area in danger in Vancouver is about 11.3% of the land.
In addition, we can find out exactly which facilities will be affected in the tsunami with the Selection tool. Here are the establishments in danger:
| Healthcare | Education |
| False Creek Residence
Villa Cathay Care home Broadway Pentecostal lodge Yaletown House Society |
Emily Carr Institute of Art & Design
Henry Hudson Elementary False Creek Elementary St- Anthony of Padua École Rose des Vents |
To get this result:
- Select by location:
a) Select features from: Vancouver_health
b) Source layer: Vancouver_danger - Right-click Attributes on the health layer, and all the health care facilities in the danger zone will be highlighted.
- To create layer, go to Data> Export Data, and export from Selected Features with the same coordinate system as the layer source.
- Name the output accordingly (i.e.: Danger_vancouver_health).
- Repeat same steps for Vancouver_education.
Once we understand what’s at risk during the tsunami, the city can formulate refuge areas and evacuation plans to prepare citizens. Also, this information is very useful for urban planners and architects when considering the proper location and the type of materials to build facilities as well as solid infrastructures that can withstand the force of a tsunami.