The representation of data through maps require high integrity and must reflect real world information efficiently. To remain objective and allow further analysis it is important to consider the influence of various methods of data classification into different quantitative groups.
Goal: to visualize spatial patterns and to match value range which will be depicted from the legend onto the map.
Here is a diagram that reflects my thought process when assessing the ideal method of classification.
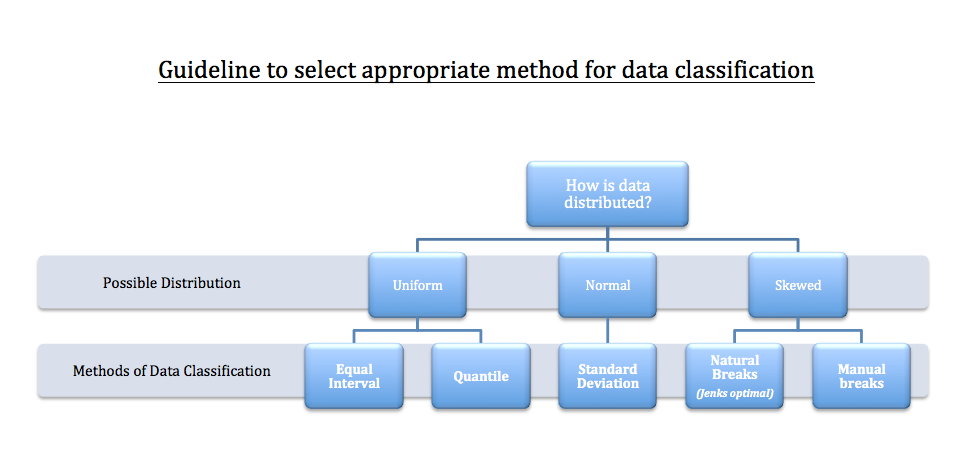
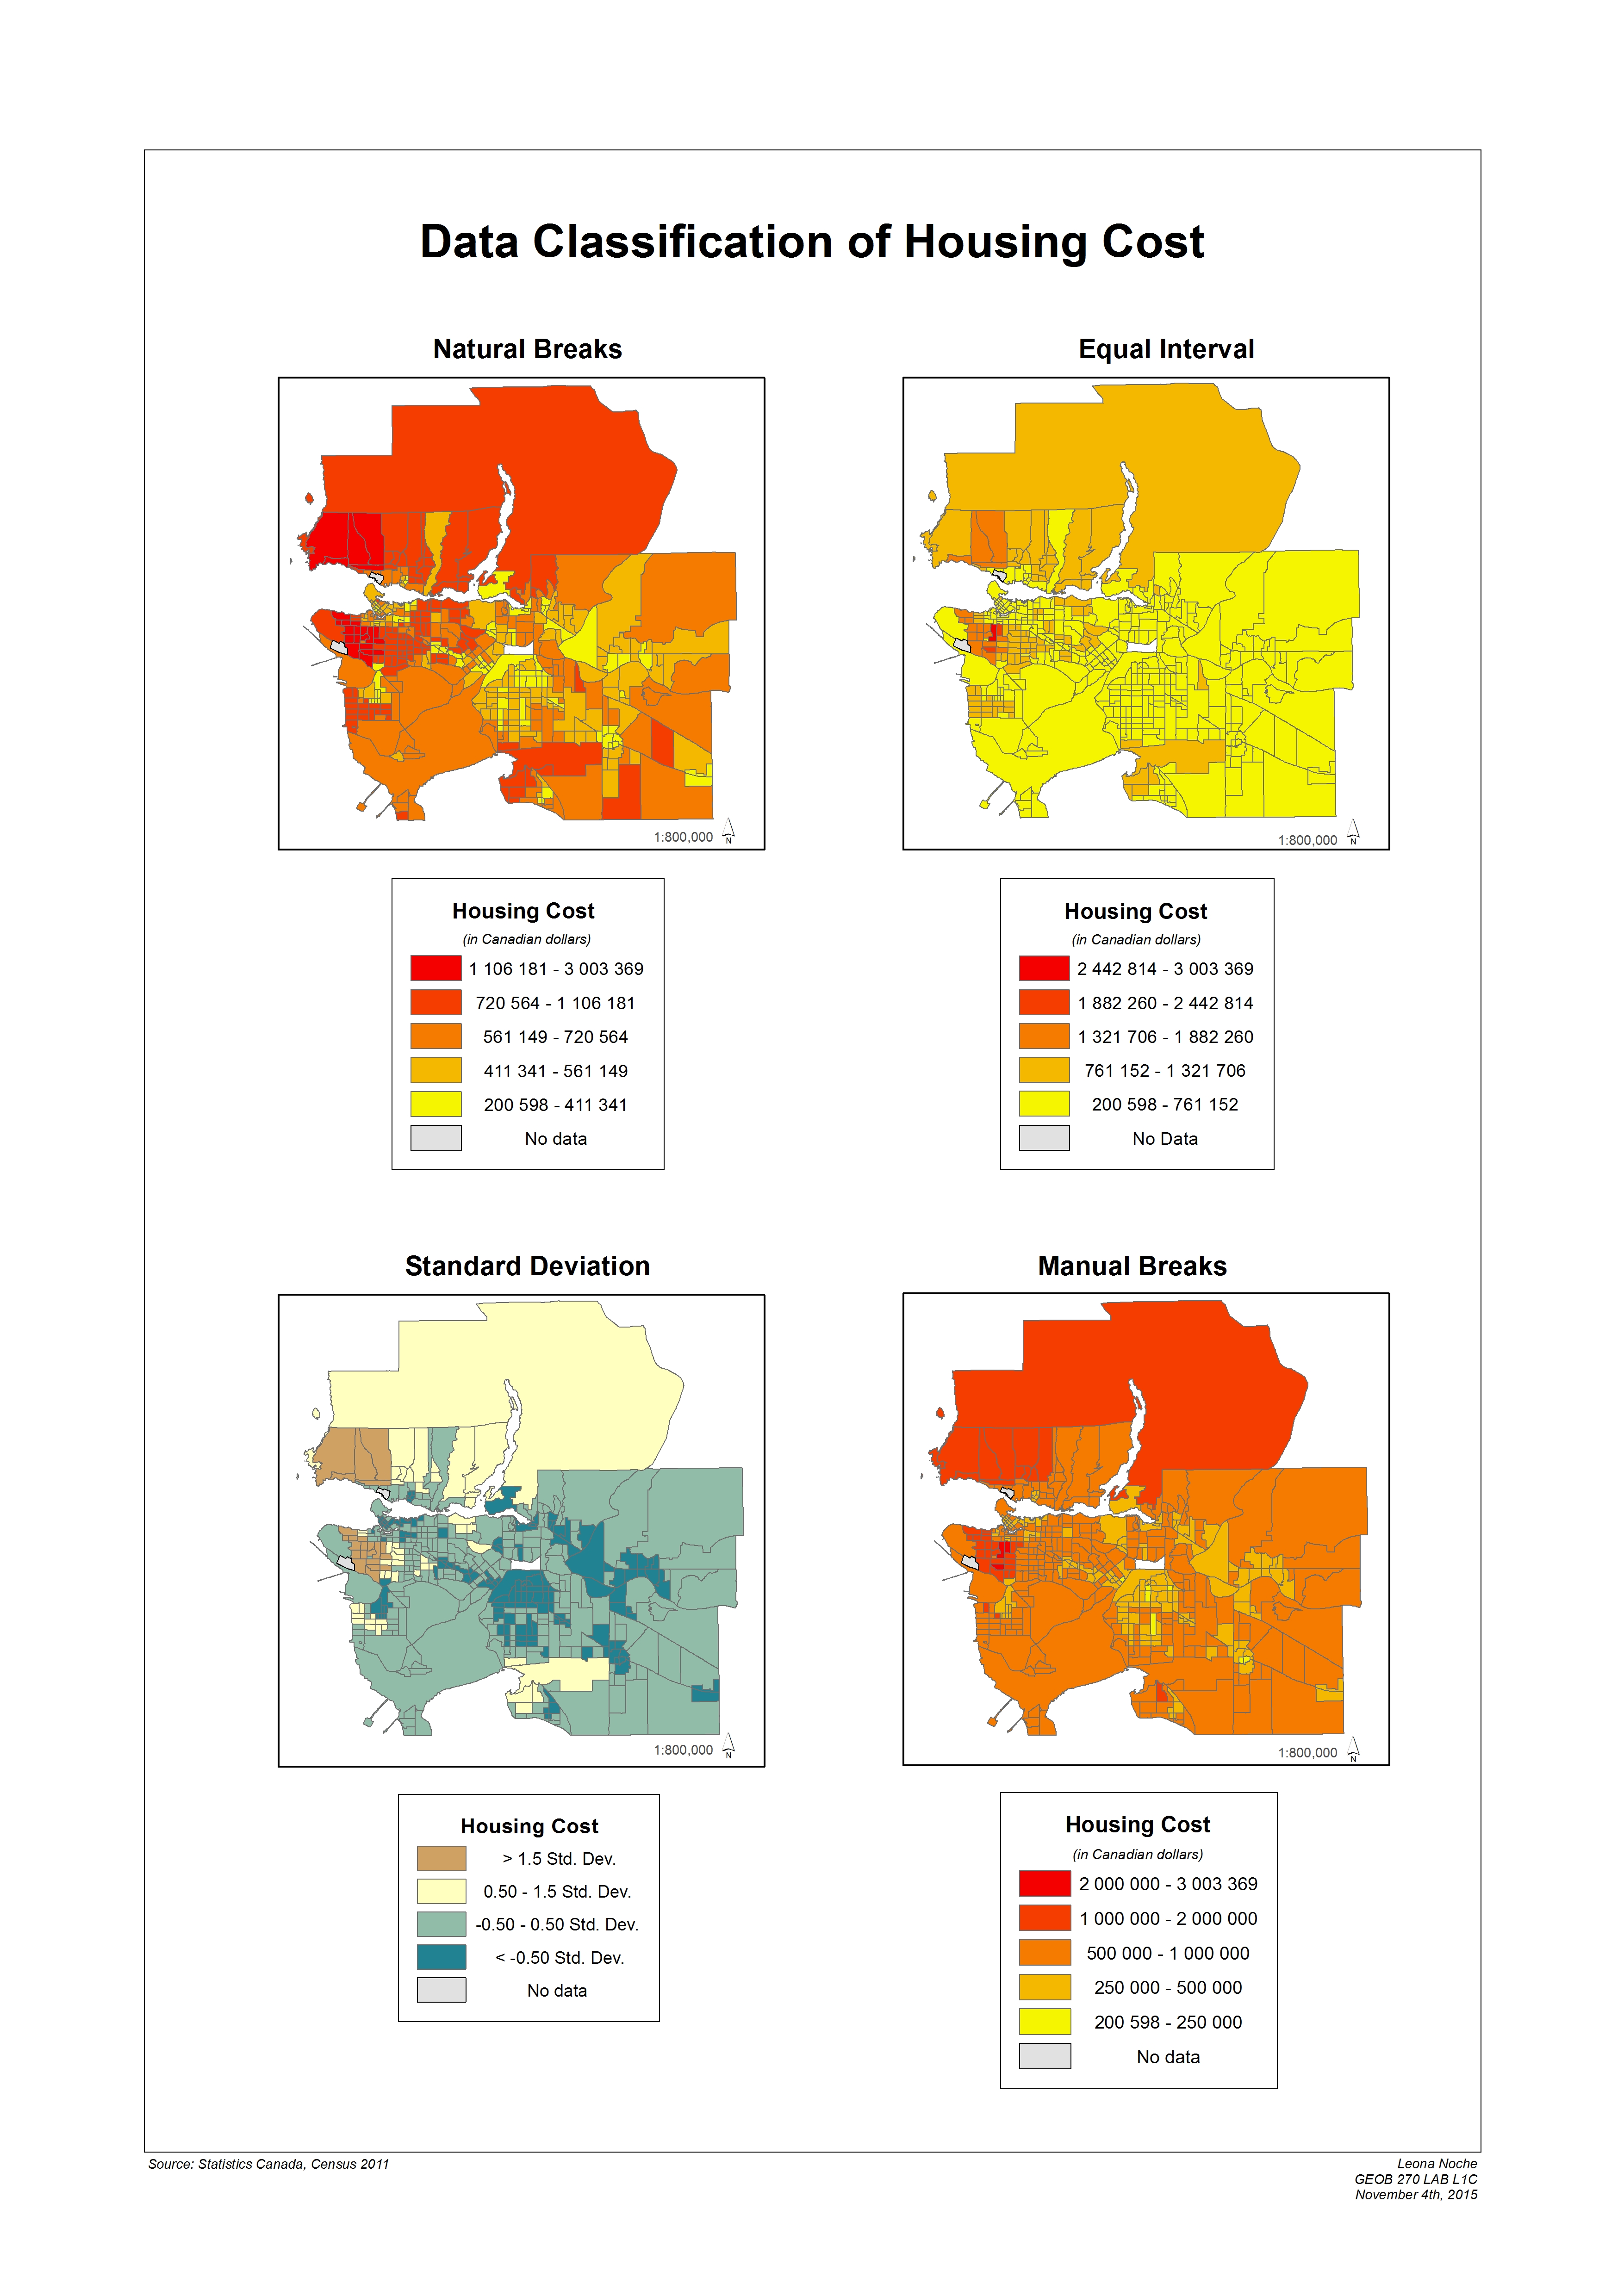
To begin, it is important to examine data. Evaluate the distribution of data, then, take a look at central tendencies, the range, and if any outliers exist. The way data is distributed often dictates which method will be used for classification (Equal Interval, Quantile, Standard Deviation, Natural Breaks or Manual Breaks). However, the pros and cons of each method must be considered when you want to represent data onto a map. For instance, Equal Interval divides the same range between each class, which is more effective when dealing with percentage. Generally, distinction is made within 5 class groups. However, since this method does not consider the distribution of data it can falsely convey information. For instance, in the map of Data Classification of Housing Cost, the lowest group is categorized between 200 598$ to 761 152$. That’s about a range of 550 000$, which is very high and makes it seem as if the majority of Metro Vancouver is decently priced. In contrast, the natural breaks seem to sort data by considering the dispersion. The Jenks-Optimization insures homogeneity within classes and heterogeneity between them. Despite that, the downfall is that the legend bracket for each class seems aleatory for certain audience, especially if they are unaware of the method. Therefore, the ideal data method classification is manual breaks. Although, it may appear as subjective as natural breaks, it becomes easier to compare between two cities and facilitates the communication of the data.