
The costs of using Zoom for my one-on-one tutorials
Zoom is a video-conferencing app that allows me to teach students without traveling long distances to meet them physically. It, and other apps like it, allowed teaching to continue during COVID lockdowns when students could not physically go to school. I prefer Zoom over Google Meet and Microsoft Teams because of its functionality and popularity among students of this generation. I am aware that certain companies and governments ban the use of Zoom due to security concerns but as an individual, the app’s usefulness compared to its competition outweigh its potential risks. Another reason I decided to dig deeper into Zoom is because Mark Mills, an author for TechCrunch, wrote “personal energy use for each two hours of video is greater than the share of fuel they would have consumed on a four-mile train ride” in what appears to be an effort to shock the reader. I found this comparison problematic since trains are highly energy-efficient and the items being compared are not clearly defined, such as the type of train and what “personal energy use” and “video” entailed. The only attempt at a reference was a hyperlinked video which is no longer accessible.
Energy Costs
Using Zoom’s recommended settings for 1:1 video calling (https://support.zoom.us/hc/en-us/articles/201362023):
- For high-quality video: 600kbps (up/down)
- For 720p HD video: 1.2Mbps (up/down)
- For 1080p HD video: 3.8Mbps/3.0Mbps (up/down)
Converting the above for two hours between two people results in the bandwidth usage below:
- HQ = 600 / 8 / 1000 / 1000 * 60 * 60 * 2 * 2 = 1.08GB
- 720p = 1.2 / 8 / 1000 * 60 * 60 * 2 * 2 = 2.16GB
- 1080p = 3.4 / 8 / 1000 * 60 * 60 * 2 * 2 = 6.12GB
- 3.4Mbps used as the average
According to Aslan et al, the transmission network electricity intensity in kWh/GB decreases by an order of magnitude approximately every seven years (Aslan et al, 2017). Using their data and extrapolating to 2022, electricity intensity can be estimated to about 0.003 kWh/GB.
- HQ = 1.08GB * 0.003kWh/GB = 0.00324kWh
- 720p = 2.16GB * 0.003kWh/GB = 0.00648kWh
- 1080p = 6.12GB * 0.003kWh/GB = 0.01836kWh
Laptop energy usage ranges from 50-100W with most common laptops using 65W (reference), which converts to 0.13kWh. Combining this data with the above, we have the total energy cost of using Zoom on a typical laptop.
- HQ = 0.00324kWh + 0.13kWh = 0.13324kWh
- 720p = 0.00648kWh + 0.13kWh = 0.13648kWh
- 1080p = 0.01836kWh + 0.13kWh = 0.14836kWh
In BC, energy is charged at $0.095/kWh for step 1.
- HQ = 0.13324kWh * $0.095/kWh = $0.0126578
- 720p = 0.13648kWh * $0.095/kWh = $0.0129656
- 1080p = 0.14836kWh * $0.095/kWh = $0.0140942
The financial cost of energy to run Zoom is negligible to the end user.
Data centres have exploded in numbers in recent decades, but their total energy consumption has remained relatively stable (Lohr, 2020). Corporations must minimize energy costs to maintain margins, so energy efficiency is a top priority.
Environmental and Human Costs
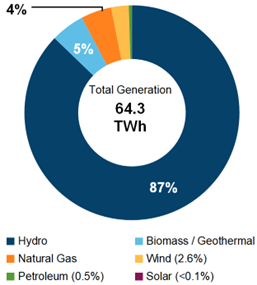
BC gets most of its electricity from hydro, which is a renewable source and has relatively few environmental effects once the construction of hydroelectric dams are complete. During construction, major costs include habitat fragmentation and alteration of wildlife, negatively impacting the livelihoods of people living downstream, and pollution from construction and construction materials.
Zoom states it uses data centres in the US, Canada, Europe, India, China, Japan, Latin America, Australia, and Hong Kong. In these locations, Zoom has its own data centres but are also speculated to use those provided by AWS, Oracle Cloud and other cloud services. Zoom has stated that users can choose their Zoom data routing (Ittelson, 2020), but it is difficult for the average user to verify if this is indeed true.
Data centres, computers, cables, and all electronics used in modern technology require elements that must be mined. Crawford goes into detail on the costs of mining with respect to the environment, human labour, and geopolitics (Crawford, 2021). The data that is extracted from end users is another cost for using most tools. An individual user cannot see the impact of giving his data to a corporation and cannot resist using a powerful tool or product just because his data is being collected. With sufficient data, corporations can alter history in major ways such as the election of one American president over another in the Cambridge Analytica scandal.
Educational Benefits of Zoom
Even after researching and discussing all these costs of using Zoom, I still believe it is an invaluable tool in education. It is probably less energy-intensive to Zoom than for me to drive my internal combustion engine car from one student’s home to the next. In many cases, even when I see a student in person, we might still use a laptop. For less confident students, Zoom provide them with some distance and space from me, which can give them more breathing room to make mistakes and attempt questions instead of having me right in front of them. Students are also able to multitask during Zoom lessons and can learn more efficiently while referencing several pages at once.
In the larger picture, these benefits may only be superficial as larger scale problems such as privacy and personal data collection issues still exist. Like Crawford states, corporations deliberately avoid transparency to keep costs out of sight and to allow themselves plausible deniability when things do not go in their favour. Zoom keeps its energy consumption, data centre locations, and data usage closely hidden which prevents a complete cost-benefit analysis of the tool.
References
Crawford, K. (2021). Atlas of AI. Yale University Press. (Chapter 1: Earth. pp. 23-51)
Mills, M. (2020). Our love of the cloud is making a green energy future impossible.
Lohr, S. (2020). Cloud Computing Is Not the Energy Hog That Had Been Feared.
Ittelson, B. (2021, March 17). Coming April 18: Control Your Zoom Data Routing. Zoom Blog. Retrieved August 2, 2022, from https://blog.zoom.us/coming-april-18-control-your-zoom-data-routing/
Government of Canada. (2022, July 13). Provincial and Territorial Energy Profiles – British Columbia. Canada Energy Regulator. Retrieved August 2, 2022, from https://www.cer-rec.gc.ca/en/data-analysis/energy-markets/provincial-territorial-energy-profiles/provincial-territorial-energy-profiles-british-columbia.html
Aslan, J., Mayers, K., Koomey, J. G., & France, C. (2017). Electricity intensity of internet data transmission: Untangling the estimates. Journal of Industrial Ecology, 22(4), 785–798. https://doi.org/10.1111/jiec.12630