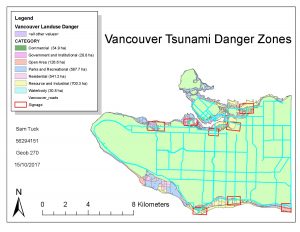
In this lab, we were tasked with making a map indicating the effects of a tsunami on Vancouver. While we have Vancouver Island to protect us from the majority of the flood damage, Vancouver would still be affected. The analysis asks: what areas would be deemed ‘danger zones’ for flooding, or ‘zones’ which are at least one kilometer from the shoreline, and are 15 meters or less above sea level. The above map includes land use type and roads for these areas which would be affected, as well as areas indicating a need of signage in the event of a tsunami in order to communicate the danger to the general public.
I found from my analysis that a total of roughly 15% of Vancouver’s total area is in danger of being affected. To find this figure I completed a number of analysis steps in Arc Map:
- Reclassified the areas below 15 metre elevation
- Performed a buffer analysis of areas 1 kilometre from the shore
- Used the intersect tool to combine the two factors into one polygon summarizing the total area at tsunami risk.
- Using this polygon, I was then able to clip the landuse data to it and determine the landuse categories which existed in this ‘danger zone’ as well as their individual areas.
For further analysis, I also identified healthcare and educational facilities which exist inside this zone by clipping city data on the location of healthcare and educational facilities to this ‘danger zone’ polygon, and identifying the location from there.
The facilities in danger from a Tsunami I found to be:
- Healthcare = BROADWAY PENTECOSTAL LODGE, COAST WEST COMMUNITY HOME, FALSE CREEK RESIDENCE, VILLA CATHAY CARE HOME, YALETOWN HOUSE SOCIETY
- Education = EMILY CARR INSTITUTE OF ART & DESIGN (ECIAD), INSTITUTE OF INDIGENOUS GOVERNMENT (IIG), HENRY HUDSON ELEMENTARY, FALSE CREEK ELEMENTARY, ST FRANCIS XAVIER, VANCOUVER MONTESSORI SCHOOL,ST JOHN’S INTERNATIONAL, HERITAGE 3R’S SCHOOL, ST ANTHONY OF PADUA, ECOLE ROSE DES VENTS
Some skills I gained as a result of this analysis:
- Reclassified DEM data from the City of Vancouver in order to identify low-elevation areas in risk of flooding through a proximity buffer analysis.
- Created vector polygons in Arc’s edit feature, delineating zones in need of tsunami danger signage, based on above areas of elevated flooding risk.
- Calculated area of risk through using attribute query functions to identify specific land use types affected by flooding.