
Fixing improperly aligned and improperly referenced spatial data:
When adding layers to maps it is possible that the individual layers may not be referenced to the same spatial reference system. To align the differing layers it may be necessary to project the data from the layer(s) into a different coordinate system. However, map projections may distort spatial characteristics including angles, shape, area, scale and direction. For instance, planar map projections distort distances. Depending on the specific analysis or calculations, the GIS analyst may use different measurement tools (eg, using the geodesic measurement tool to measure the shortest flight path for an airplane). ArcGIS contains a built-in “projection-on-the-fly” system, but this tool merely manipulates the layers such that the layers appear to be correctly aligned to the user. In reality, these layers may be referenced to different coordinate systems. As such, it may be necessary to manually complete a projection of the layers so as to ensure that all the layers on the map share a common coordinate system. The steps for completing a projection are listed as follows:
- Add the layer that you need to project to the Table Of Contents
- Check the coordinate system of the layer by accessing the “Properties” tab
- Launch ArcToolbox within ArcMap
- Navigate through Data Management Tools > Projections and Transformations > Project
- Input desired term for “input dataset”
- Input desired term for “output dataset”
- Input desired term for “output coordinate system”
- Click “OK”
- Add the layer to the map
Advantages to using remotely sensed Landsat data for geographic analysis:
The Landsat program is a remote sensing project utilizing satellites to scan the earth continuously. Landsat data is gathered by measuring different wavelengths of reflected energy emitted by the sun. The user may combine these different readings of the different “bands” (wavelengths) to produce composite color images. One of the advantage of using Landsat data for geographic analysis comes from this ability to produce color images. For instance, Landsat data allows the user to precisely gauge the change in landscape when comparing the topography of Mt. St. Helens before and after the 1980 volcanic eruption. Specifically, the contrast between the composite color images from 1979 and 2002 allows the user to see the expansion of Spirit Lake and the change in shoreline. In this way, Landsat data is well-suited to producing images with a clear message (ie showing a clear change over time).
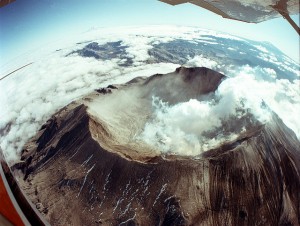
Mt. St. Helens
The eruption of Mt. St. Helens in Washington State in May 1980 resulted in a variety of projects at Pacific Northwest National Laboratory. The work included sampling and analysis of the ash, biological effects studies, and public information programs. This shot was taken from our research aircraft as it collected atmospheric samples near the crater.
For more information, visit www.pnl.gov/news/
(Above image courtesy of Pacific Northwest National Laboratory)