
Methods
This report has been conducted through both quantitative and qualitative research methods. First, a literature review was executed looking at an abundance of transportation reports along the corridor. An expert interview with Ian Fisher, Manager of Planning and Operations at Sky Train was completed for a better understanding of the type of service that can be implemented. This report also looked into a variety of databases including BC Data and the BC Ministry of Transportation and Infrastructure. Finally, GIS software allowed for the creation of maps and supplementary analysis to determine possible train station locations.
Literature
An abundance of literature on transportation options along the Sea to Sky corridor was consulted in the creating of this report. (AECOM 2009, CANAC 2001, District of Squamish 2009, Seymour 2001, TransLink 2011, TSi 2002, Washbrook 2003). Many of these reports touched on topics such as demand, costs, type of service and review of communities along the line. Although these reports were highly influential for the results of this report, several gaps can be found in the literature. For example, many of the reports are from the early 2000s, during this period there was a large demand to look at transportation options along the Sea to Sky corridor in preparation for the 2010 Winter Olympic Games. For the Olympics it was decided to expand Highway 99, however since the Olympics have past, very little research has been on done on transportation options in the region. It is also notable that many of the reports didn’t measure demand for a train in response to a range of fair costs. Often the reports would have a high passenger cost for a train service, and because of the high cost it would deter ridership. This report tries to bridge the gaps and encourages the District of West Vancouver to provide a commuter train service along the Sea to Sky Corridor.
GIS Analysis
Flow Chart

GIS Procedures:
In any MCE analysis you must first obtain your data, normalize it, then add weights using a tool such as weighted sum.
Once we obtained our data on population, zoning, slope and transportation connections we had to normalize it. For zoning, this meant combining several land uses into fewer more easily understandable classes such as: commercial, residential, industrial, institutional, and reserves. Once all of the data was properly arranged and joined together, we had to turn our criteria into a raster and reclassify the values. For our reclassification we gave important factors a score of 1, and low factors a score of 0. For example, any slope less than 45 degrees got a value of 1 and a slope above 45 degrees got a value of 0. In addition, any bus route within 500 metres of the train line got a value of 1, and areas above 1000 metres got a value of 0. Once all our criteria was normalized, we had to determine weights using the weighted sum tool.
Weighted Sum
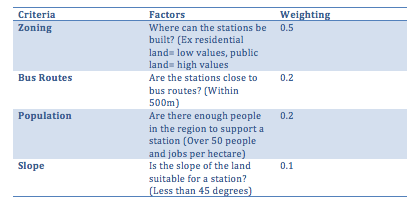
The weighting in the above table is shown in Map 4: Suitability of Train Stations in Squamish and Map 5: Suitability of Train Stations in West Vancouver, District of North Vancouver, and City of North Vancouver. We determined these weights by discussing with local transit planners what are important factors in train station locations.
Sensitivity Test
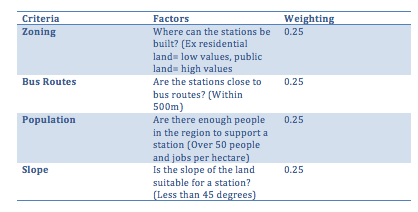
The weighting in the table above is shown in Map 6: Sensitivity test of Suitability of Train Stations in West Vancouver, District of North Vancouver, and City of North Vancouver. This chart represents are sensitivity analysis where we gave equal weights to each factor.
Extract by Mask
After weighing each criteria we produce a raster layer, one with different and the other with equal weights, which we used as input and masked it with the 30m buffer around the rail line to produce the final suitability map as seen in Map 4, 5 and 6. We choose a 30 metre buffer because we thought this would be an adequate amount of space for a train station.