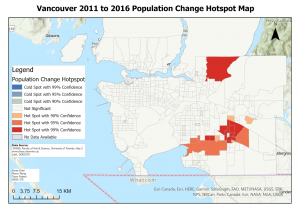
Based on the analysis, most of the hotspots are located in Langley. There is one hotspot in Coquitlam with a 99% confidence level. There is no significant population change in other regions such as Richmond and Vancouver between 2011 and 2016.

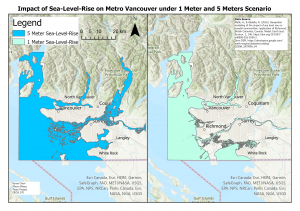
There are significant changes in the impact of sea-level rise between 1 meter and 5 meters. The map on the left represents the 5 meters sea-level-rise, which mostly overwhelmed the Richmond and Delta area, and part of Surrey and Langley is also affected. The map on the right side represents the 1 meters sea-level rise, in which the coastal areas at Richmond and Surrey are at risk.
There are significant changes in the impact of sea-level rise between 1 meter and 5 meters. The map on the left represents the 5 meters sea-level-rise, which mostly overwhelmed the Richmond and Delta area, and part of Surrey and Langley is also affected. The map on the right side represents the 1 meters sea-level rise, in which the coastal areas at Richmond and Surrey are at risk.

The affected hotspot areas are generated after intersecting the hotspot with the 5 m sea-level rise. Then we used the Metro Vancouver Zoning map to identify the residential area and found out that only one small piece is within the residential area, whereas others are farmland or forest. It indicates that between 2011 and 2016, there was a significant population move into the sea-level-rise risk area.

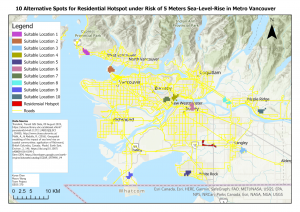
Based on the Multiple Criteria Analysis, the 10 alternative areas are located as shown below, each with the same area as the residential hotspot under risk, which provides information to the government for residential development potential sites that can replace the area if extreme conditions occur. Among these 10 sites, suitable location 2 is not under the residential development plan of the city currently since it is within the Stanley Park area.

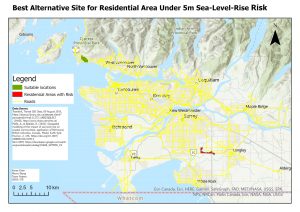
We are also interested in the best site out of the 10 alternatives in our Multiple Criteria Analysis. Thus, the number of regions located was set to 1 in the ‘locate’ tool and computed the suitability model several times to ensure the accuracy result (Shown below). The best area is located at the corner of West Vancouver. The area has excellent views, good elevation, relatively low population, convenient transport, and a slight slope, which in reality matches our expectation and explains our result.

