GEOG 481 Blog 5 – Urban Growth Since The Meiji Restoration

February 3rd, 2018, will mark the 150th anniversary of the Meiji Restoration. With such a milestone being reached, it will be a year in which many Japanese citizens, and historians the world over, will look back at Japan’s storied history. In a span of 150 years, Japan has been transformed from an isolated feudal kingdom to one of the world’s most powerful advanced-industrial powers. The multitude of changes Japan has experienced over the course of one and a half centuries is nearly immeasurable. Changes in culture, government, foreign policy, technology, and philosophy, to name a few, characterize the spirit of the Meiji Restoration, and a post-Bakufu Japan. Urbanization, however, provides a comprehensive yet simplistic view into this modernization process. Looking at the period of roughly 130 years, from the birth of the Meiji period (1868) until 2000, Japan’s modernization process can be divided into four distinct stages. These stages are characterized by levels of urbanization and growth of urban centers.

First Stage (1868 – 1930)

             The first stage covers a period of more than 60 years, from the Meiji Restoration until the dawn of the Great Depression. The modern growth of Japanese cities is directly tied to structural economic changes that occurred in the early years following the Restoration (1868 – 1912). Throughout this period, mass migrations from rural areas to urban centers were prompted by a shift in economic activity. Agriculture, mining, forestry, and fishing eventually gave way to manufacturing, concentrated in cities. Moreover, during this period the percentage of the population living in cities of 50,000, or more, grew from less than 8% to more than 16%. Furthermore, the proportion of the population living in cities of any size increased from 10%, in 1868, to 24% by 1930. This shift in population clusters accompanied a decline in employment in the primary rural sector, dropping from more than 80% to around 50%.

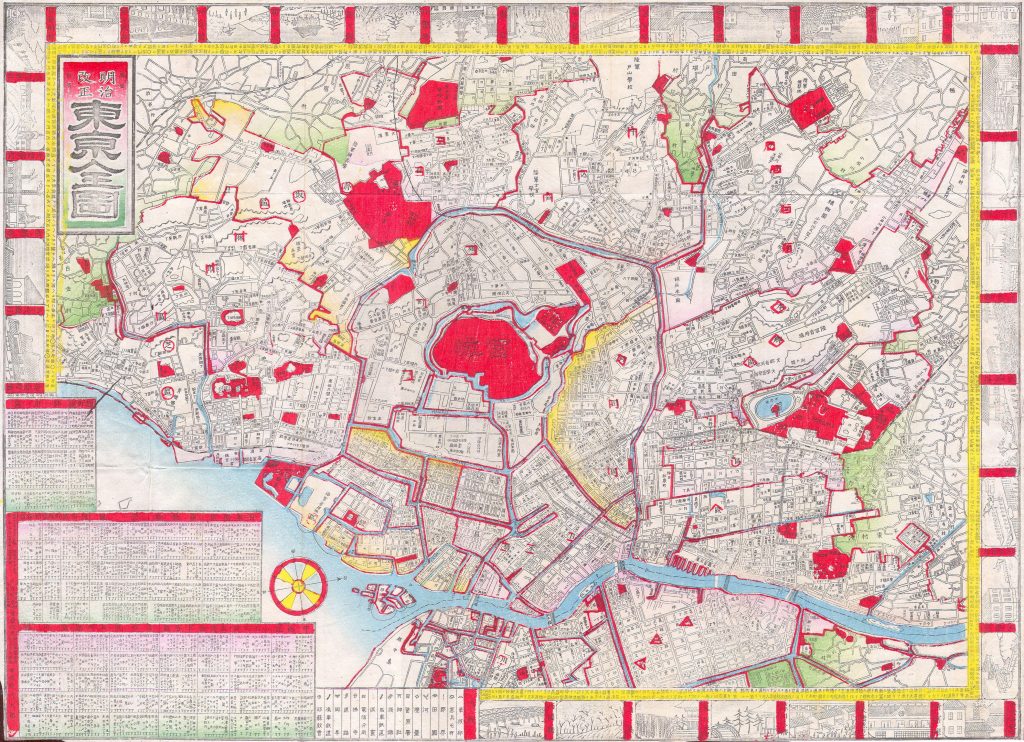
fig. 1. A map from 1880 detailing Tokyo, during the infancy of the Meiji Period

Second Stage (1930 – 1950)

             During the second stage, occurring from 1930 until 1950, urban growth rose considerably, jumping from 24% of the population living in cities, to 37% by 1950. This was likewise accompanied by a decline in employment in the primary sector, dropping to 41% by 1950. This period also saw the beginnings of a trend that has continued to this day; the development of metropolitan areas. In 1920, there existed only 16 cities with populations greater than 100,000 people. The combined population of all these cities only constituted some 12.2% of Japan’s total population. Tokyo and Osaka each had populations greater than 1 million, accounting for 6.2% of the total national population. By 1940, the number of cities with more than 100,000 inhabitants increased to 45, with a combined population of 29.4% of Japan’s total population. By 1940, there were likewise 4 cities with populations greater than 1 million. These included Tokyo, Osaka, Kyoto, and Nagoya. Their combined populations accounted for 17.2% of the total national population.

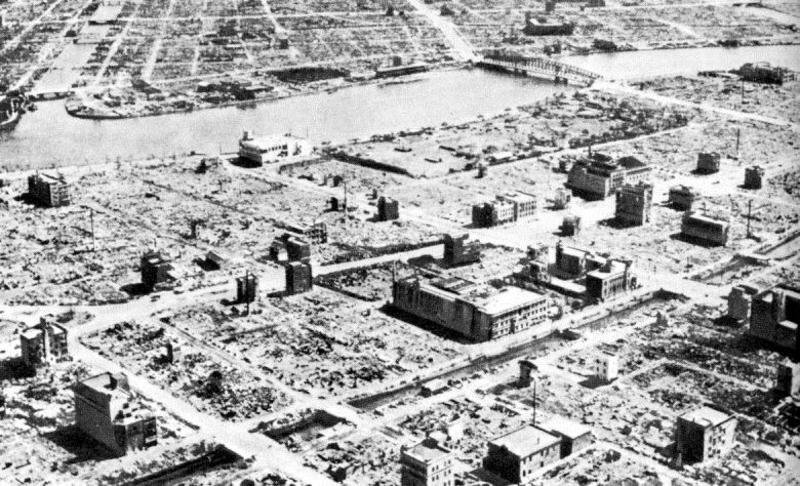
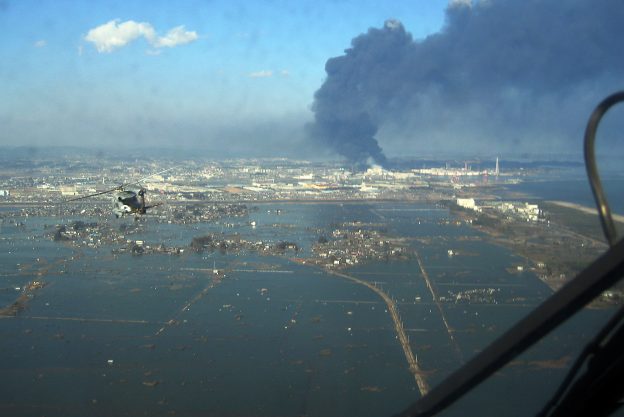
fig. 2. Arial photo of Tokyo following American firebombing runs during the Second World War.

Following the Second World War, although the number of cities with more than 100,000 people had increased to 64, the proportion of people living in these cities, relative to the total national population, had declined to 25.7%. Likewise, the proportion of the population living in cities of more than 1 million declined to 11.4%. Looking at absolute numbers, Tokyo’s population decreased from 6.8 million (1940), to 5.4 million (1950). In the same period, Osaka’s population dropped from 3.3 million to 2 million. These sharp declines can be attributed to the series of mass evacuations from urban centers prompted by American strikes, in particular the firebomb raids, on the Japanese mainland.

Third Stage (1950 – 1970)

             The third stage of urban modernization, occurring from 1950 to 1970, is characterized by high economic growth, reflected in intensified urbanization. In 1950, only 37% of the population lived in urban cores. By 1970, however, this had increased to 72%. Throughout this period, the labor force in the primary sector had declined from a high of 41% to less than 21%. This was accompanied by a massive wave of rural migrants to urban centers. Post-war economic recovery only accelerated these processes, bringing with it new economic opportunities in cities. By 1960, the number of cities with populations exceeding 1 million people had increased to six (Tokyo, Osaka, Kyoto, Nagoya, Yokohama, and Kobe). Tokyo’s population grew to 8.3 million people, as Osaka’s rose to 3 million. By 1970, the number of cities with populations over 100,000 rose to 150. Their combined populations equaled more than 50% of the total national population, marking a pivotal turning point in Japan’s population dynamics. As many as 25 rural prefectures experienced population declines, coinciding with the post-war economic boom. Despite what seemed like exponential urban growth, migration into the Greater Tokyo Area reached a peak in 1962, with similar peaks occurring around the same time in Kyoto, Osaka, Kobe, and Nagoya.

Fourth Stage (1970 – 2000)

             The period from 1970 onward makes up the fourth stage of urbanization. In this period, urban populations exceeded 75% of Japan’s total population, and labor force in the primary sector dropped below 10%. There would be difficulties in this process however. The oil crisis of 1973, having sparked a global recession, likewise affected Japan, slowing its urbanization rate. Furthermore, declines in the conversion of land to urban use in metropolitan areas slowed the urbanization process. By 1975, four more cities joined the growing list of urban centers with populations greater than 1 million people. These included Kitakyushu, Sapporo, Kawasaki, and Fukuoka. The population of the ten cities with populations >1 million now equaled 20.8% the total national population. Population declines in Tokyo and Osaka dropped this number to 19.9% by 1980, however. That same year, Yokohama surpassed Osaka as the second most populated city, with 2.8 million inhabitants. By 1990, there existed 209 cities with populations upwards of 100,000, with a combined total population of more than 72 million people. Hiroshima experienced a significant population jump, exceeding 1 million inhabitants by 1995, bringing the total number of “million” cities to 11. Save for Sapporo, all of these are located within the Megalopolis.

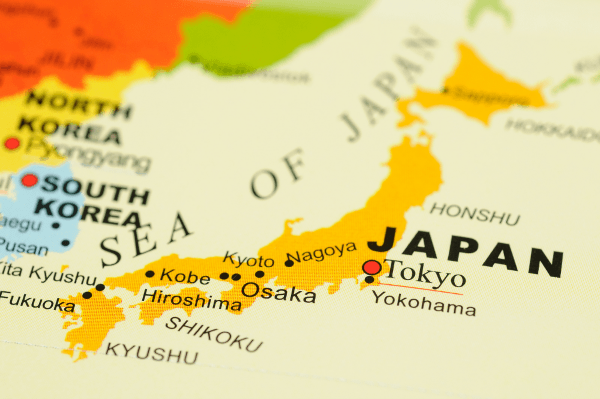
fig. 3. A map detailing major urban centers in Japan.

The post-industrial economic transition, from 1970 – 2000, caused certain populations centers to figuratively “explode”. The Tokyo Metropolitan Area grew to a high of 39 million people, a concentration of 32% of Japan’s total population within one urban center. While Tokyo, Osaka, Nagoya, Kobe, and Kitakyushu’s rates of urbanization began to taper off in the mid 1990’s, all of the other “million” cities experienced continued growth. By 1990, the areas constituting the Densely Inhabited Districts (DID) were home to some 78 million people. Essentially, 63.2% of the total population living on 3.11% of the nation’s total surface area. By 1995, this number grew to 81 million (64.7% of total population living on 3.24% of nation’s surface area). The population of inner wards of all the major cities began to decline during this period. Most evident in Tokyo, Osaka, and Nagasaki, this trend is characterized by a higher elderly population, an increase in one-person households, a decline in blue-collar workers, the dispersion of commercial facilities, and the centralization of professional workers.

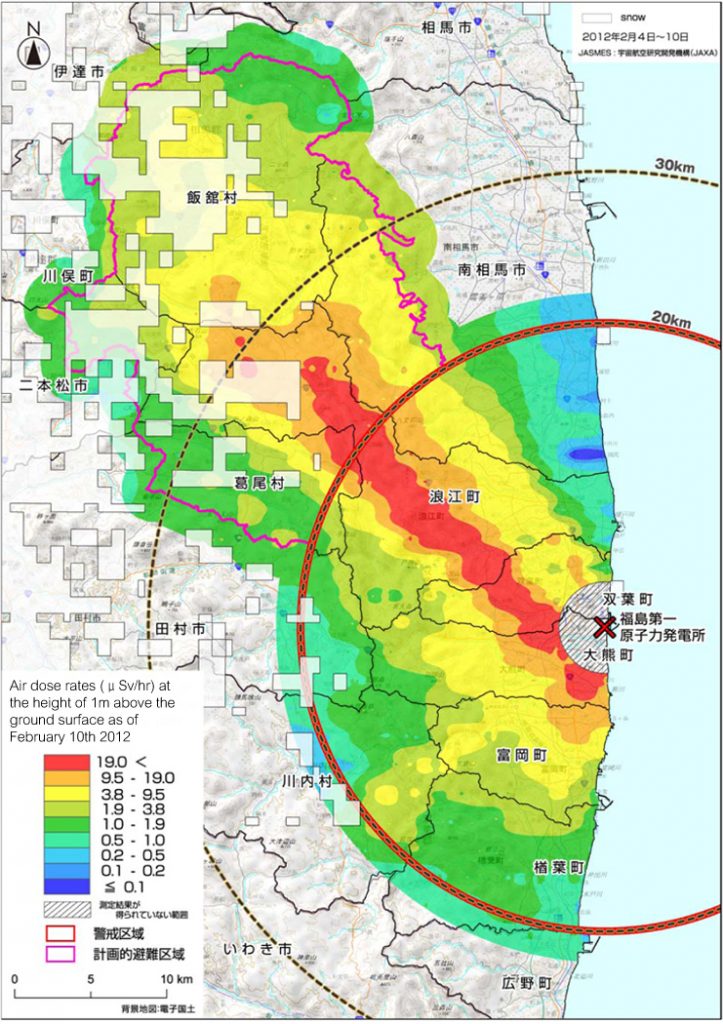
fig. 4. Population of the “million” cities, between 1995 and 2003.

Urbanization is but one of many changes that can be examined to convey the scope of Japan’s transformation over the last 150 years. As the nation’s birthrate continues to decline, however, it will be interesting to see how these population dynamics change once again. To this extent, it can be argued that we are witnessing the cusp of a new stage in Japan’s urbanization process. With available land being in short supply, and a population that is slowly decreasing, Japan’s demographic and geographic realities will have a marked effect on the concentration of individuals in urban centers. In retrospect, what is considered the fourth and final stage of urbanization, may simply be another chapter in Japan’s storied history.

Sources

Cox, Wendell. “The Evolving Urban Form: Tokyo”. Newgeography, June 20, 2012. http://www.newgeography.com/content/002923-the-evolving-urban-form-tokyo

Karan, Pradyumna P. “Japan In The 21st Century: Environment, Economy, And Society”. The University Press of Kentucky, Lexington, 2005. P. 243 – 248.

fig.1. https://upload.wikimedia.org/wikipedia/commons/b/b1/1880_Japanese_Meiji_Woodblock_Map_of_Tokyo_(EDO)_-_Geographicus_-_Tokyo-meiji-1880.jpg

fig. 2. https://www.globalresearch.ca/bombs-bursting-in-air-the-us-firebombing-and-atomic-bombing-of-japan/5365530

fig. 3 & fig. 4. Karan, Pradyumna P. “Japan In The 21st Century: Environment, Economy, And Society”. The University Press of Kentucky, Lexington, 2005. P. 247


GEOG 481 Blog 4 – Fukushima: A Geographic Black Hole

As we near the seven-year anniversary of the 3/11 Disaster, a world of unfortunate memories rears its ugly head. These range from images of tsunami waves engulfing towns, to red-cross campaign advertisements. What characterizes memorable tragedies such as the Tohoku earthquake, subsequent tsunami and nuclear disaster, is a sense that while the pain of such memories lingers, we, as a society, have moved on. We apply a mindset that such events have faded away, and that, while the effects on the lives of human beings may have been significant at the time, a plethora of disasters afterwards has effectively willed the pain of such past events away. However, when it comes to the Fukushima prefecture, and Japan as a whole, like all other disasters, this mindset could not be further from the truth. Six years, eight months, and twenty days later, the lives of hundreds of thousands of people, irrevocably changed that day, are still reeling from the effects of the Nuclear Disaster. The area around the Fukushima-Daiichi nuclear power plant has become something of a geographic black hole. With much controversy surrounding the now-dubbed “exclusion zone”, a world of competing narratives makes it difficult to understand the true extent of the damage, both in nominal and theoretical terms. Some former residents wish to abdicate their refugee status and return home. Others are fearful of the long-term radiation damage to the region. Some corporations are pressuring residents to return home, while possibly fearing that the region is still unsafe, while some researchers claim that the extent of radiation damage is overblown. In short, with so many differing opinions, no one is quite sure what the future of the region holds.

Following the magnitude 9.1 earthquake, the subsequent 40-meter tsunami that struck Fukushima triggered a meltdown at the Tepco (Tokyo Electric Power Company) owned Fukushima-Daiichi Nuclear Power Plant. 150,000 people, living within roughly twenty kilometers of the power plant, were evacuated. Almost seven years on, and the refugees of the disaster face a new dilemma: judging how much radiation in their former homes is safe. Recovery efforts, thus far, have collected roughly nine million cubic meters of contaminated top soil and washed down buildings and roads. The government’s plan is to reduce outdoor radiation exposure to 0.23 microverts per hour. In September 2014, the Japanese government began a process of lifting evacuation orders for the seven municipalities within twenty kilometers of the nuclear plant. Initial estimates expected up to 70% of refugees to be returned home by spring of this year. As that time has come to pass, it is obvious that recovery efforts, and the lives of the displaced, are far from normal.

fig. 1. A map detailing the exclusion zone around the Fukushima-Daiichi nuclear power plant

Many refugees face a difficult decision between safety and compensation issues. Many claim they are being pressured into returning home, despite radiation exposure levels, they fear, are still too high. Moreover, TEPCO has announced a plan to discontinue financial compensation packages to people who do not return to their former homes, in the evacuation area. In an interview, Katsunobu Sakurai, the mayor of Minamisoma, voiced the concerns of former residents in stating, “There has been no education regarding radiation. It’s difficult for many people to make the decision to return without knowing what these radiation levels mean and what is safe”.

In 2015, Akira Ono, the plant manager, tried to qualm these fears, stating that plant conditions are, “really stable”, and that radioactivity from the nuclear fallout has fallen substantially between the time of the disaster and the time of his interview. Cleanup has been anything but smooth, however. It is still mostly unclear where the nuclear fuel is located in the dilapidated former power plant. In 2014, the manager of the plant, outlined a plan to decommission the site over a thirty to forty year course. It would involve removing melted nuclear fuel masses in tandem with demolishing the site’s four main reactors. In total, this plan will cost roughly $9 billion. TEPCO intends to begin the process of removing nuclear debris in 2021. In December 2014, crews removed the last of the 1535 fuel rods stored in the Unit 4 spent fuel pool. In the beginning of 2015, Ono put the recovery effort at, “around 10%”, complete. With much work still to be done, a major topic of concern is whether residents can return to their homes safely, given they are being pressured to do so, despite obvious indicators as to the safety of the former evacuated zones.

Despite the fears of refugees, and the admitted challenges TEPCO faces with disaster recovery, some researchers rebuke the notion that the entirety of the exclusion zone is uninhabitable. Professor Geraldine Thomas, of Imperial College in London, believes that radiation levels are currently safe, and that the perception created by both the Japanese government, and media outlets around the world has scared refugees into returning home. In a 2016 interview with BBC, Dr. Thomas voiced her views on the situation surrounding the exclusion zone, “People have to feel safe to come back. Many will now not want to come back because they’ve made a life elsewhere. But in terms of radiation, the amount we are getting now is very small, and if you were inside a building you’d be getting even less than standing in the open air.” She views media hysteria as having created a fear around the exclusion zone, essentially promoting an idea that despite data saying otherwise, the area is akin to a Chernobyl-esque forbidden city.

fig. 2. Satellite image showing one of the reactors at the Fukushima-Daiichi nuclear power plant as it begins to overheat due to damage from the magnitude 9.2 earthquake & tsunami, on March 11th 2011. (Photo by DigitalGlobe via Getty Images)

On a journalistic inquiry into the safety of Okuma and Namie, Rupert Wingfield-Hayes, a reporter for BBC, found that radiation levels in the exclusion zone were measured at around 3 microsieverts of radiation per hour. These levels were not measured in parts of Okuma and Namie that have been decontaminated either, they were in non-remediated zones. In theory, if one were to stand in this area for twelve hours a day, for a year, they would only receive an annual extra dose of radiation around 13 millisieverts. Although that measure is not insignificant, it is well below what modern data suggests is harmful to long-term health. Most industrial countries allow nuclear facility workers to receive up to 20 millisieverts a year. Contrast this, and Okuma & Namie’s radiation levels, with Ramsar, Iran. Its background radiation rate measures at 250 millisieverts a year.

fig. 3. A map detailing surface radiation levels in the Fukushima region. (February 10, 2012)

Alas, the issue of relocation is much more complex than it initially seems. The exclusion zone surrounding the Fukushima-Daiichi nuclear power plant has become a geographic encircling of controversy. With a plethora of competing narratives as to the safety of the region, the lives of refugees from the region continue to be negatively impacted. Some residents would like to return, feeling a sense of connection to their ancestral homes. Others, still fearful of potential health impacts, find themselves pressured to do so, against their will, by TEPCO. In summation, only time will shed light on how this issue will be tackled. With so many people displaced, all with their own views on the exclusion zone, both TEPCO and government agencies will have to address the viability of returning refugees to the region, sooner rather than later.

Sources

Normile, Dennis. “Five Years After the Meltdown, Is It Safe to Live Near Fukushima?” Science, 2 March 2016.

TEPCO. Fukushima Daiichi NPS Prompt 2017. Tokyo Electric Power Company, 1 November 2017. http://www.tepco.co.jp/en/press/corp-com/release/2017/1464560_10469.html

Wingfield-Hayes, Rupert. “Is Fukushima’s Exclusion Zone Doing More Harm Than Radiation?” BBC News, 10 March 2016.

fig. 1. http://www.safeandgreencampaign.org/action-center/solidarity-with-fukushima-japan/voices-of-fukushima

fig. 2. http://www.vocativ.com/296141/fukushima-five-years/index.html

fig. 3. http://www.japan-reishi.org/news/en_map.html

Featured image: https://imgur.com/gallery/KabxJ


GEOG 481 Blog 2 (Updated for submission) – The Challenges of the 2020 Olympic & Paralympic Games

As the 2020 Olympic and Paralympic games draw nearer, it becomes clear that the 32nd Summer Olympiad, for all of its benefits, brings with it a myriad of challenges. Among these include the scrapping of a 2-billion-dollar center-piece stadium, an original logo mired with plagiarism allegations, cost overruns, ineffective leadership, finger pointing, and doubts that the Japanese government will be prepared for the games, on time.

This, however, is not unlike recent Olympic Games. Every Olympic Games since 1960 (for which there is data) exceeded its budget by around 179%. The 2014 winter Games, held in Sochi, Russia, came with a whopping 66.7-billion-dollar price tag (More than 5 times over budget and surpassing Beijing 2008 as the most expensive Games of all time).

Tokyo has waded through similar problems before, however, during the preparation of the 1964 Olympics, which could be regarded as one of the most successful Games of all time. The ’64 Olympics kick started a massive urban transformation within the city of Tokyo, lifting it, and Japan as a whole, from the ashes of WWII, and bringing the nation back onto the world stage. Although these Games were successful, they left a troubled legacy many have forgotten, and one that could be unfortunately repeated.

fig. 1. The National Gymnasium complex under construction in Tokyo on June 6, 1964, just a few months before the games were to begin. (Keystone/Hulton Archive/Getty Images)

Tokyo’s 2020 bid relied heavily on the promise of transformation coupled with increased public support. The city’s 2016 bid failed primarily because of the lack of public support. A 2009 poll showed that only 56% of Japanese citizens supported hosting the games (The lowest among the 4 candidate cities). Following the 2011 Triple Disaster, this changed, and the nation rallied together longing for a symbol to lift their hopes. In March 2013, roughly 70% of the Japanese public supported the idea of hosting the 2020 Games.

Similar to the 1964 Games, in terms of Japan looking to lift itself from disaster through the Olympics, yet different to the extent that this time around, the IOC saw Tokyo as a safe bet (In comparison with Istanbul & Madrid), Tokyo was awarded the Games on September 7th, 2013. In mid-January, 2015, allegations surfaced that bribery, on behalf of the Japanese Government, played a heavy role in this decision. This would be the first of many controversies surrounding the 32nd Olympiad.

fig. 2. Japanese Prime Minister Shinzo Abe (3-R) celebrates alongside Tokyo 2020 delegation members after IOC president Jacques Rogge announced the Japanese capital to be the winner of the bid to host the 2020 Summer Olympic Games, during the 125th session of the International Olympic Committee (IOC), in Buenos Aires, on September 7, 2013. The three cities bidding to host the 2020 Summer Olympics — Madrid, Istanbul and Tokyo — delivered their final presentations ahead of the expected tight vote by the IOC, though Madrid was eliminated from the race moments after, in the first round of voting. AFP PHOTO / YAN WALTON (YAN WALTON/AFP/Getty Images)

The initial budget proposed sat at only 7-billion dollars, to be used mostly on infrastructure updates. The 1964 Games were characterized by the Japanese Government’s intention to not only rebuild Tokyo, and the nation alike, but to double GDP while modernizing the economy. The 2020 Games, however, are starkly different in this remark, not even adding to Prime-Minister Shinzo Abe’s “Abenomics” plan.

In September 2015, the official logo was scrapped as plagiarism allegations surfaced. Shortly thereafter, the new national stadium’s original design was likewise replaced, due to cost overruns ($1.3 billion to $2.1 billion). The price of the stadium led to such fierce public backlash, that Shinzo Abe’s handpicked sports minister (and political ally), Hakubun Shimomura, officially resigned from his position. In December 2015, a more modest stadium-design was picked, with an expensive price tag of 1.26-billion dollars and fears that it may not be built on time.

fig. 3. This picture taken on July 24, 2015 shows hammer throw gold medalist Koji Murofushi (2nd R) and young athletes attending a ceremony to unveil the new logos of the Tokyo 2020 Olympic (L) and Paralympic Games at the Tokyo city hall. AFP PHOTO / Yoshikazu TSUNO (YOSHIKAZU TSUNO/AFP/Getty Images)

If recent history is an indicator, no nation should expect to come under budget when hosting the Olympics. This is especially worrying for a nation such as Japan, bogged down by a sizeable national debt, and in the midst of a prolonged recession. The 2012 Games in London spent 5 times their initial projection. The 2004 Games in Athens spent 16 times theirs (This contributing to Greece’s financial meltdown and collapse some years later). So far, the estimated cost is expected to exceed 15-billion dollars, higher than the original budget. Furthermore, this figure could rise if the pattern of the last few Games is followed. The increased cost of the Games has had a direct impact on the public, as well. The shohizei (consumption tax) has risen from 5% to 8%, and is expected to climb further to 10% this year. Japan’s national debt already sits at $11-trillion, roughly 245% of GDP. The 2020 Games could be a difficult cost to shoulder if they continue to run over-budget.

fig. 4. Architect Kengo Kuma explains his design of the stadium during a press conference announcing new design of the national stadium in Tokyo on December 22, 2015. Japan Sports Council chose a new, slimmed down 2020 Olympic Stadium design, after an earlier version set off a row over a 2.0 billion USD price tag that would have made it the world’s most expensive sports venue. / AFP / TOSHIFUMI KITAMURA (TOSHIFUMI KITAMURA/AFP/Getty Images)

In many ways, Tokyo is a fantastic host-city for the Olympics. It truly is a city of the future, and a showcase of one of the greatest modernization stories in history. The city has adequate roads, efficient public transportation, and a friendly populace. Yet despite this, fears still loom on what kind of an impact these games will have on Japan’s future. Unlike 1964, Japan is not in a position wherein showcasing itself is the only way to achieve revitalization. In this day and age, such a showcase may spread the nation’s resources too thin. In any case, we will have to wait until the Summer of 2020 to hope for a successful Olympiad, and wait longer to understand its long-term effects.

Sources

Associated Press. “Tokyo 2020 Bid Gains Support”. ESPN. March 5, 2013.

Crouch, Ian. “Tokyo 2020: A Perfect Olympic Vision?” The New Yorker. September 10, 2013.

Himmer, Alastair. “Tokyo Bid Suffers In IOC Support Poll Of Residents”. Reuters. May 2, 2009.

Roberts, David and Robert Whiting. “Are the Tokyo 2020 Olympics In Trouble?” Foreign Policy. February 19, 2016.

Spitzer, Kirk. “Troubled Tokyo Olympics Is Creating An Olympian Headache For PM Abe”. USA Today. December 25, 2015.

Wilson, Stephen. “IOC Asks For Transcripts Suggesting 2020 Olympic Bid Bribery”. Associated Press. January 15, 2016.

Yan, Sophia. “IMF Warns Japan Over Its Staggering National Debt”. CNN Money. July 24, 2015.


GEOG 481 Blog 3 – Foreign Exchanges: Emigration From Japan

Although not considered a nation many would emigrate from, Japan, like many countries around the globe has often been the point of origin of citizens spanning many nations, namely in Asia, North America, and South America. The patterns of these emigrational flows are products of history as much as they are of geography, and revolve primarily around geo-political relations, and economic incentives. They are dichotomized, however, by region. As emigration to the Americas, and to Asia is based on fundamentally distinct power dynamics between Japan and those respective regions.

The Americas

The early twentieth century was characterized by several waves of emigration of Japanese laborers, to Hawaii, California, and British-Columbia. These emigrants were known as dekasegi. These destinations changed however, as Japanese sentiment during the period before the Second World War prompted emigrants to shift their prospects from North-America to South-America, namely Brazil and Peru. These migrations ceased with the outbreak of the war, as Canada, the United-States, and Latin American countries closed their borders to Japan. By 1940, about 500,000 Japanese migrants and their descendants were estimated to be living in North and South-America.

The end of the Second World War reopened formal relations between Canada, the United-States, and Latin American countries with Japan. A small number of Japanese migrants made way for the U.S., Canada, Paraguay, Brazil, and Argentina in the immediate aftermath of WWII. These migrations reflected Japan’s post-war devastation, as a lack of employment opportunities, a result of the destruction of key economic centers, coupled with the restrictions enacted under the unconditional surrender, effectively incapacitated the nation and its populace. At its peak, Japanese emigration exceeded 15,000 migrants in 1958. As the Economic Miracle began to take form, these numbers started to dwindle. In 2000, 790,000 Japanese emigrants were permanent residents of the nations they migrated to, of this, around 36% resided in the United-States, and 12% in Brazil. In total, some 1.4 million Japanese emigrants lived abroad in 2000, 670,000 in the U.S., 1.3 million in Brazil, and 80,000 in Peru.

fig. 1. A map detailing the number of Japanese emigrants living in Latin America, divided by post-war emigrants and people with Japanese ancestry as of May, 2000

In an attempt to manage the war-ravaged economy and 6 million civilians and military personnel repatriated from former Japanese colonies and occupied territories in Asia, the Japanese government made attempts to encourage emigration. Central and South American countries were considered to be ideal candidates for emigration, as these nations had a storied history of Japanese settlement. The social infrastructure of previous Japanese settlers existed in these countries, and more importantly during the post-war atmosphere, little anti-Japanese sentiment existed in them. Despite this, many Japanese settlers faced unfavorable conditions and a lack of infrastructure in Latin American countries. Worse yet, the Japanese government did little in addressing these concerns or raising them with foreign diplomats. In 1951, the Brazilian government agreed to accept 5000 Japanese families for emigration into the Amazon region. To aid with emigration efforts, the Japanese government created the Federation of Japan Overseas Associations, setting up a special government corporation to extend soft loans for emigration with funds borrowed from American banks. Under the organization, and ten year emigration plan was devised to send out 426,000 emigrants. This process was anything but smooth, however, as the interministry struggle for leadership between the Foreign Ministry and Agriculture and Forestry Ministry hindered the development of infrastructure needed to improve the land designated to emigrants. The first wave of post-war migrants arrived to the Amazon region in 1953. Less than a month after their arrival, however, many of the emigrant families had deserted their assigned settlements. In total, some 6000 Japanese citizens emigrated to the Amazon region during the postwar era. In 2000, around 13,000 people of Japanese descent lived in the region, located in three settlements: Guama, Quinari, and Bela Vista.

fig. 2. A Map of the Amazon River detailing some of the settlements Japanese emigrants migrated to in 1953, in this map Belem and Manaus are visible

Asia

In response to the end of relations with American countries, Japanese laborers emigrated to newfound colonies and territories, such as southern Sakhalin, Taiwan, Korea, and Manchukuo. This was done to alleviate population pressure faced in Japan and to provide relief from the economic depression that had spread since the early 1930’s. In the period between 1929 and 1937, Japanese migrants to Manchukuo increased from 814,000 to around 1.8 million. This was reciprocated with a considerable influx of Korean and Chinese migrants into Japan. Between 1942 and 1945, around 4 million people left Japan (military and civilian) for Manchukuo. To offset this massive drop in population, Japan forcefully migrated some 400,000 Koreans to meet labor shortages. The end of the war ended this emigration/migration flow, however, as roughly 5.7 million Japanese returned to Japan, and 1.2 million Korean and Chinese migrants were returned to their respective countries.

fig. 3. A map detailing the extent of the Japanese Empire, at its height, in 1942

Sources:

Karan, Pradyumna P. “Japan In the 21st Century: Environment, Economy, and Society”. The University Press of Kentucky, 2005. p.187 – 190

Header image: http://d-maps.com/carte.php?num_car=3264&lang=en

fig. 1. Karan, Pradyumna P. “Japan In the 21st Century: Environment, Economy, and Society”. The University Press of Kentucky, 2005. p. 188

fig. 2. Google Maps

fig. 3. http://www.emersonkent.com/map_archive/pacific_1942.htm

GEOG 481 Blog 2 – Disaster Early Warning Systems & the 2020 Olympic Games

Due to its location on the Pacific Rim, Japan is an island nation with a storied history of being inundated by natural disasters. The nation has experienced, and proven, its resilience through a myriad of typhoons, earthquakes, and tsunamis. Each event proves as a valuable learning opportunity, wherein the nation’s defenses, and disaster mitigation strategies are retooled to be more effective. An integral part of this disaster mitigation strategy are Japan’s preventive early warning systems. These systems detect and give warnings in the event of both earthquakes and tsunamis, and stand as the most advanced on Earth. Pushed to their limits during the 2011 Tohoku Triple Disaster, the two systems will play an important part in ensuring safety during the 2020 Olympic and Paralympic games in Tokyo.

fig. 2. A tectonic map of the North-East Pacific, detailing the fault lines Japan rests on

Kinkyu Jishin Sokuho

Launched on October 1st, 2007, the Japan Meteorological Agency provides residents with earthquake early warnings. This system is formally known as the EWS and collects seismic data from a network of over one thousand seismographs, nationwide. It provides estimates of seismic intensities along with a rough arrival time of principle motion, derived from wave data near the epicenter. What sets it apart from most detection centers, however, is the fact that the data is then used to alert instant warnings. These include texts messages, alerts on television and radio networks, and the automatic slowing down and stoppage of trains, elevators, and factories. The extent to which this system has been integrated into Japanese life will prove valuable in the event of an earthquake during the games.

However, the system is not without its flaws. Primarily, the time between initial detection, and the main tremor is a matter of seconds if not tenths of seconds. Moreover, magnitude estimation along with seismic intensity estimation can be flawed. The system has issues with differentiating between simultaneous yet separate events. Furthermore, the greater the intensity, the harder it is for the system to provide a magnitude estimate. Drawing on data from individual seismographs can likewise be risky, as accidents, lightning, or systemic failures can trigger false alarms. In a scenario wherein strategies must be formulated within seconds, these errors can make the difference between survival and catastrophic loss of life.

Deep-ocean Assessment and Reporting of Tsunami (DART®) stations

The DART system, developed by the National Oceanic and Atmospheric Administration (NOAA), in the United-States, serves as the second pillar of Japan’s Tokyo 2020 early warning and disaster mitigation strategy. The system, comprised of over thirty-nine buoy-mounted detection systems, measures ocean pressure in tandem with sea-surface height estimates, to provide advanced warnings on developing tsunamis. Each detection system consist of an anchored seafloor bottom pressure recorder (BPR) attached to a moored surface buoy, for real-time communication. An acoustic link transmits the data from the BPR to the surface buoy. The BPR collects temperature and pressure measurements at 15-second intervals, and these pressure values are corrected for temperature effects. The pressure is then converted to an estimated sea-surface height (height of ocean surface above seafloor), by using constant 670 mm/psi. DART uses two reporting modes; event and standard. Operating routinely in standard mode, four spot values of the regular 15-second interval data are collected and reported during the scheduled transmission times. Once the internal detection software identifies an anomaly, the system ceases standard operation and enters event mode. In event mode, the system transmits 15-second interval data while providing 1-minute averages. It also records the initial time of the anomaly, in the event that an estimated time between tsunami formation and landfall is calculated. The system does not return to standard mode until 4 continuous hours of regular 1-minute averages have been recorded.

fig. 1. A diagram of the DART II System

Given Japan’s location on the North American, Pacific, Eurasian, and Philippine tectonic plates, the nation (and its detection systems) are used to tectonic activity. Regardless, this has not made Japan apathetic to even slight tremors, but more watchful of any sized events. Most Olympic committees fear political turmoil or terrorist activity may harm the success of their games. Tokyo 2020’s committee must worry about human factors in tandem with the high-possibility of a tectonic related disaster. As the wounds of the 2011 Triple Disaster have yet to heal, it will be interesting to see how the island nation will respond in the horrifying event of a major earthquake, or tsunami during the Olympic Games.

 Sources:

Japan Meteorological Agency. Earthquake Early Warning System, 2017, http://www.jma.go.jp/jma/en/Activities/eew.html.

Knight, Will. “How Japan’s Earthquake and Tsunami Warning Systems Work.” MIT Technology Review, 11 March, 2011, https://www.technologyreview.com/s/423279/how-japans-earthquake-and-tsunami-warning-systems-work/

Talbot, David. “Intelligent Machines: 80 Seconds Of Warning For Tokyo .” MIT Technology Review, 11 March, 2011, https://www.technologyreview.com/s/423274/80-seconds-of-warning-for-tokyo/

Birmingham, Lucy. “Japan’s Earthquake Warning System Explained.” TIME, 18 March, 2011, http://content.time.com/time/world/article/0,8599,2059780,00.html

Kumagai, Jean. “In Japan Earthquake, Early Warnings Helped.” IEEE Spectrum, 15 March, 2011, https://spectrum.ieee.org/tech-talk/computing/networks/japans-earthquake-earlywarning-system-worked

McCurry, Justin. “Olympic Task: Tokyo is already in crisis management mode for 2020 games.” The Guardian, 1 September, 2016, https://www.theguardian.com/public-leaders-network/2016/sep/01/tokyo-2020-olympic-games-crisis-management-earthquakes

(Figure. 1.) National Oceanic and Atmospheric Administration. Deep-ocean Assessment and Reporting of Tsunamis (DART) Description, 2017, http://www.ndbc.noaa.gov/dart/dart.shtml

(Figure. 2.) http://academic.emporia.edu/aberjame/tectonic/japan/japan.htm

(Featured Image) http://www.navy.mil/view_image.asp?id=98323


GEOG 481 Blog 1 – What Prompted the Meiji Restoration?

Following roughly two and a half centuries of Tokugawa Bakufu rule, Japan rapidly transformed itself into one of the world’s preeminent powers, in a transition that occurred “overnight” in historical terms. This transition, historic in both its pace and effectiveness, can be understood as the result of a number of interconnected central factors, most prominent being China’s fate during the mid-19th century, Commodore Mathew C. Perry’s “gunboat diplomacy” and the larger implications of the treaty of Kanagawa, as well as the general discontent of several daimyo towards the Bakufu system.

Fig. 1. Tokugawa Iemochi, the 14th Shogun of the Tokugawa Bakufu, ruling from 1858 – 1866

Matthew C. Perry & The Treaty of Kanagawa

Following the signing of the Treaty of Nanking, in 1842, the United-States wanted to join nations such as Britain in carving up trade opportunities and ports in China. Naturally, sailing from California, Japan is located directly on the route to China. Moreover, the North Pacific was home to thousands of whales, prompting hundreds of American whalers to hunt in these waters. These two factors of geography prompted the United-States to seek trade opportunities with the Tokugawa Bakufu, initially requesting that the Bakufu open its ports to sell coal, food, and water to American ships, and to provide emergency aid to distressed American crews near Japan. Eleven ears after the Treaty of Nanking, on July 8th 1853, Matthew C. Perry, an American navy commodore on orders from President Millard Filmore, sailed into Edo Bay to deliver a letter requesting that Japanese foreign trade be resumed. After delivering the letter, Perry left, promising to return within a year for a reply to the President’s request. On the 14th of February, 1854, Perry returned with an eight-ship armada, leveeing the threat of force against the Tokugawa Bakufu, effectively forcing an agreement to be signed. On March 31st, 1854, Japan signed the Treaty of Kanagawa (Yokohama), which opened two ports, Shimoda and Hakodate, to shipwrecked American sailors and American trade. This prompted Britain, Russia, and France to all sign similar agreements, each completed before 1856.

Fig. 2. Commodore Matthew C. Perry and his Armada, on orders from the President, arrive in Edo Bay (1854)

The Modernization Impetus 

These treaties expanded the Japanese’s understanding of the world around them. The nation was impressed by American technological superiority, and the Japanese soon realized that in order to avoid the fate of China, they would need to modernize. Many began to realize that the Tokugawa, which had ruled Japan for centuries, were inept at facing the challenges of the 19th century. In order for Japan to survive, thus modernizing, it would have to do away with the system of military governance of the past. In 1868, leaders from the two remote southern domains of Satsuma and Choshu seized the Imperial Palace in Kyoto in an effort to restore the power of the Meiji emperor. Merely fourteen years after the Treaty of Kanagawa, the Tokugawa Bakufu, ruling for over two centuries, was brought to a sudden end. Japanese leaders began reorganizing the nation, sending convoys the world over to study all facets of modern life in nations around the globe. With this data, Japan adopted practices similar to many western nations, including American business practices, French legal systems, British naval structure, and most importantly, Germany’s authoritarian military-machine. Japan modelled itself most closely along the lines of Bismarck’s empire.

Success of Modernization & Its Effects Pre-WWI

Toshio Mizuuchi, an Osaka-based geographer, has attributed the rapidly successful modernization of Japan, in all aspects, to the proper execution of development policies and the establishment of transportation facilities. He notes five specific policies as being central to this transition:

  1. Policy of river & flood control, and water resource management
  2. Road construction & maintenance
  3. Harbour construction & maintenance
  4. Railway construction
  5. Policy of city &  regional planning

Bearing these policies in mind, Japan’s remarkably efficient transition from a quasi-feudal state, into a modern world power begins to make sense. In 1894, a mere 26 years after the Meiji Restoration, Japan attacked China, forcing an indemnity payment, the release of Korea, later annexed by the Japanese in 1910, and the release of Taiwan (then referred to as Formosa). Ten years later, in 1904, Japan attacked Russia, shocking the world by winning the war on both land and sea. If Japan’s victory over China turned heads, her victory over Russia forced world powers to take note that not only had Japan become an economic power, but a prominent military force as well. Japan seized the southern half of Sakhalin Island, and Russia’s railroad and port concessions in southern Manchuria.

fig. 3. Japanese soldiers decapitate Chinese POW’s during the First Sino-Japanese War. (Utagawa Kokunimasa, October 1894)

Driven by a fear of annexation, and fuelled by a desire to modernize, the end of Tokugawa rule and the Bakufu system, resulted in the creation of a modern economic & military superpower in Japan. Her rapid succession, all these years later, still challenges most understandings of national transition, however, as history has shown, this desire for superiority would have disastrous consequences for East-Asia, and eventually, Japan itself.

Sources

Gordon, Andrew. “A Modern History of Japan”. Oxford University Press, 2014. P.47-55.

Karan, Pradyumna P. “Japan In the 21st Century: Environment, Economy, and Society”. The University Press of Kentucky, 2005. P. 61-63.

Figure 1: https://commons.wikimedia.org/wiki/File:Toku14-2.jpg

Figure 2: https://commons.wikimedia.org/wiki/File:Визит_Перри_в_1854_году.jpg

Figure 3: https://ocw.mit.edu/ans7870/21f/21f.027/throwing_off_asia_01/2000_380_07_l.html