February 3rd, 2018, will mark the 150th anniversary of the Meiji Restoration. With such a milestone being reached, it will be a year in which many Japanese citizens, and historians the world over, will look back at Japan’s storied history. In a span of 150 years, Japan has been transformed from an isolated feudal kingdom to one of the world’s most powerful advanced-industrial powers. The multitude of changes Japan has experienced over the course of one and a half centuries is nearly immeasurable. Changes in culture, government, foreign policy, technology, and philosophy, to name a few, characterize the spirit of the Meiji Restoration, and a post-Bakufu Japan. Urbanization, however, provides a comprehensive yet simplistic view into this modernization process. Looking at the period of roughly 130 years, from the birth of the Meiji period (1868) until 2000, Japan’s modernization process can be divided into four distinct stages. These stages are characterized by levels of urbanization and growth of urban centers.
First Stage (1868 – 1930)
The first stage covers a period of more than 60 years, from the Meiji Restoration until the dawn of the Great Depression. The modern growth of Japanese cities is directly tied to structural economic changes that occurred in the early years following the Restoration (1868 – 1912). Throughout this period, mass migrations from rural areas to urban centers were prompted by a shift in economic activity. Agriculture, mining, forestry, and fishing eventually gave way to manufacturing, concentrated in cities. Moreover, during this period the percentage of the population living in cities of 50,000, or more, grew from less than 8% to more than 16%. Furthermore, the proportion of the population living in cities of any size increased from 10%, in 1868, to 24% by 1930. This shift in population clusters accompanied a decline in employment in the primary rural sector, dropping from more than 80% to around 50%.

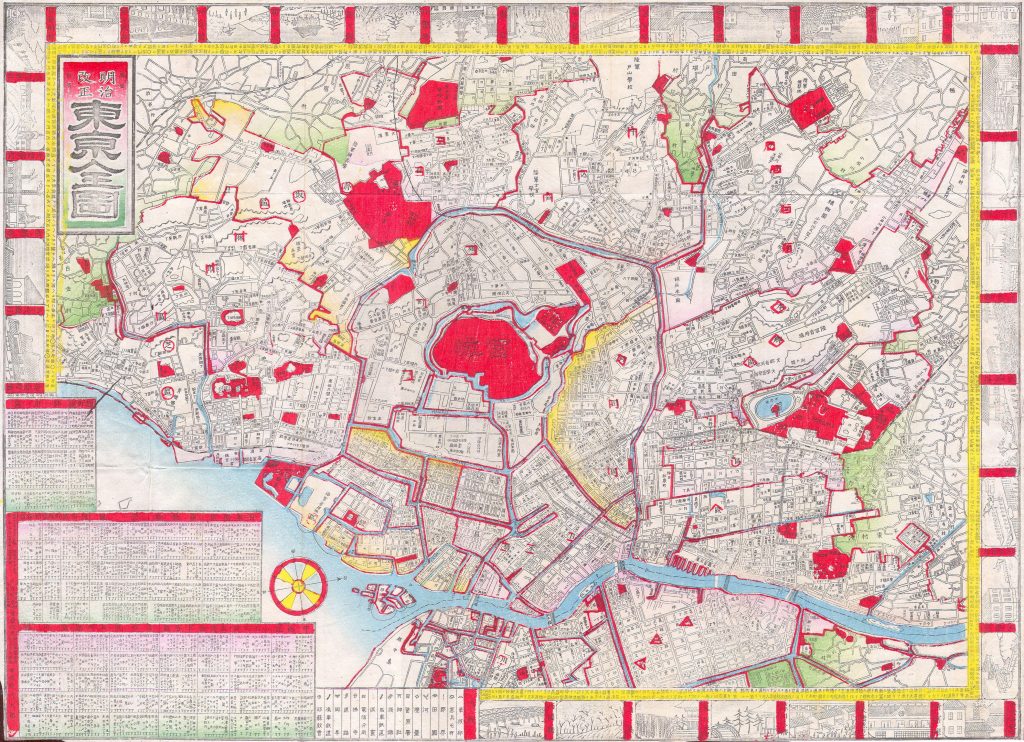
fig. 1. A map from 1880 detailing Tokyo, during the infancy of the Meiji Period
Second Stage (1930 – 1950)
During the second stage, occurring from 1930 until 1950, urban growth rose considerably, jumping from 24% of the population living in cities, to 37% by 1950. This was likewise accompanied by a decline in employment in the primary sector, dropping to 41% by 1950. This period also saw the beginnings of a trend that has continued to this day; the development of metropolitan areas. In 1920, there existed only 16 cities with populations greater than 100,000 people. The combined population of all these cities only constituted some 12.2% of Japan’s total population. Tokyo and Osaka each had populations greater than 1 million, accounting for 6.2% of the total national population. By 1940, the number of cities with more than 100,000 inhabitants increased to 45, with a combined population of 29.4% of Japan’s total population. By 1940, there were likewise 4 cities with populations greater than 1 million. These included Tokyo, Osaka, Kyoto, and Nagoya. Their combined populations accounted for 17.2% of the total national population.

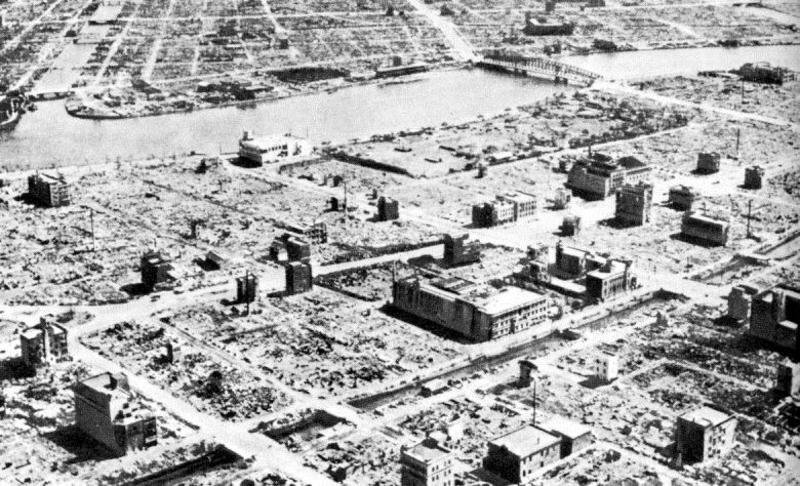
fig. 2. Arial photo of Tokyo following American firebombing runs during the Second World War.
Following the Second World War, although the number of cities with more than 100,000 people had increased to 64, the proportion of people living in these cities, relative to the total national population, had declined to 25.7%. Likewise, the proportion of the population living in cities of more than 1 million declined to 11.4%. Looking at absolute numbers, Tokyo’s population decreased from 6.8 million (1940), to 5.4 million (1950). In the same period, Osaka’s population dropped from 3.3 million to 2 million. These sharp declines can be attributed to the series of mass evacuations from urban centers prompted by American strikes, in particular the firebomb raids, on the Japanese mainland.
Third Stage (1950 – 1970)
The third stage of urban modernization, occurring from 1950 to 1970, is characterized by high economic growth, reflected in intensified urbanization. In 1950, only 37% of the population lived in urban cores. By 1970, however, this had increased to 72%. Throughout this period, the labor force in the primary sector had declined from a high of 41% to less than 21%. This was accompanied by a massive wave of rural migrants to urban centers. Post-war economic recovery only accelerated these processes, bringing with it new economic opportunities in cities. By 1960, the number of cities with populations exceeding 1 million people had increased to six (Tokyo, Osaka, Kyoto, Nagoya, Yokohama, and Kobe). Tokyo’s population grew to 8.3 million people, as Osaka’s rose to 3 million. By 1970, the number of cities with populations over 100,000 rose to 150. Their combined populations equaled more than 50% of the total national population, marking a pivotal turning point in Japan’s population dynamics. As many as 25 rural prefectures experienced population declines, coinciding with the post-war economic boom. Despite what seemed like exponential urban growth, migration into the Greater Tokyo Area reached a peak in 1962, with similar peaks occurring around the same time in Kyoto, Osaka, Kobe, and Nagoya.
Fourth Stage (1970 – 2000)
The period from 1970 onward makes up the fourth stage of urbanization. In this period, urban populations exceeded 75% of Japan’s total population, and labor force in the primary sector dropped below 10%. There would be difficulties in this process however. The oil crisis of 1973, having sparked a global recession, likewise affected Japan, slowing its urbanization rate. Furthermore, declines in the conversion of land to urban use in metropolitan areas slowed the urbanization process. By 1975, four more cities joined the growing list of urban centers with populations greater than 1 million people. These included Kitakyushu, Sapporo, Kawasaki, and Fukuoka. The population of the ten cities with populations >1 million now equaled 20.8% the total national population. Population declines in Tokyo and Osaka dropped this number to 19.9% by 1980, however. That same year, Yokohama surpassed Osaka as the second most populated city, with 2.8 million inhabitants. By 1990, there existed 209 cities with populations upwards of 100,000, with a combined total population of more than 72 million people. Hiroshima experienced a significant population jump, exceeding 1 million inhabitants by 1995, bringing the total number of “million” cities to 11. Save for Sapporo, all of these are located within the Megalopolis.

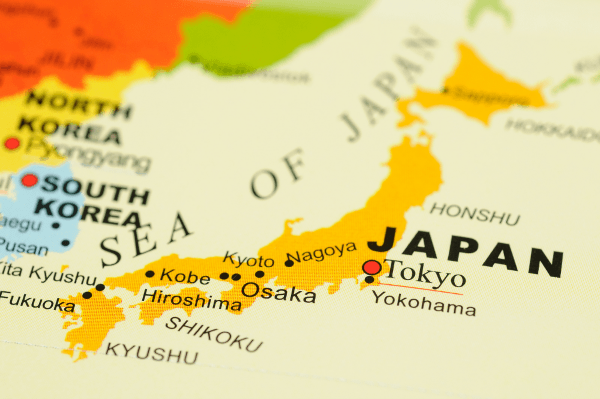
fig. 3. A map detailing major urban centers in Japan.
The post-industrial economic transition, from 1970 – 2000, caused certain populations centers to figuratively “explode”. The Tokyo Metropolitan Area grew to a high of 39 million people, a concentration of 32% of Japan’s total population within one urban center. While Tokyo, Osaka, Nagoya, Kobe, and Kitakyushu’s rates of urbanization began to taper off in the mid 1990’s, all of the other “million” cities experienced continued growth. By 1990, the areas constituting the Densely Inhabited Districts (DID) were home to some 78 million people. Essentially, 63.2% of the total population living on 3.11% of the nation’s total surface area. By 1995, this number grew to 81 million (64.7% of total population living on 3.24% of nation’s surface area). The population of inner wards of all the major cities began to decline during this period. Most evident in Tokyo, Osaka, and Nagasaki, this trend is characterized by a higher elderly population, an increase in one-person households, a decline in blue-collar workers, the dispersion of commercial facilities, and the centralization of professional workers.

fig. 4. Population of the “million” cities, between 1995 and 2003.
Urbanization is but one of many changes that can be examined to convey the scope of Japan’s transformation over the last 150 years. As the nation’s birthrate continues to decline, however, it will be interesting to see how these population dynamics change once again. To this extent, it can be argued that we are witnessing the cusp of a new stage in Japan’s urbanization process. With available land being in short supply, and a population that is slowly decreasing, Japan’s demographic and geographic realities will have a marked effect on the concentration of individuals in urban centers. In retrospect, what is considered the fourth and final stage of urbanization, may simply be another chapter in Japan’s storied history.
Sources
Cox, Wendell. “The Evolving Urban Form: Tokyo”. Newgeography, June 20, 2012. http://www.newgeography.com/content/002923-the-evolving-urban-form-tokyo
Karan, Pradyumna P. “Japan In The 21st Century: Environment, Economy, And Society”. The University Press of Kentucky, Lexington, 2005. P. 243 – 248.
fig.1. https://upload.wikimedia.org/wikipedia/commons/b/b1/1880_Japanese_Meiji_Woodblock_Map_of_Tokyo_(EDO)_-_Geographicus_-_Tokyo-meiji-1880.jpg
fig. 2. https://www.globalresearch.ca/bombs-bursting-in-air-the-us-firebombing-and-atomic-bombing-of-japan/5365530
fig. 3 & fig. 4. Karan, Pradyumna P. “Japan In The 21st Century: Environment, Economy, And Society”. The University Press of Kentucky, Lexington, 2005. P. 247
