Memo: Garibaldi at Squamish Proposal

gis_lab5_eia_export2gis_lab5_hillshade_export1

As a natural resource planner, there are a number of issues regarding the proposed ski resort that must be addressed in order to successfully continue with the project. My goal is to provide information as to which issues are of particular importance to ensure the project does not negatively impact both the project area and the surrounding park.

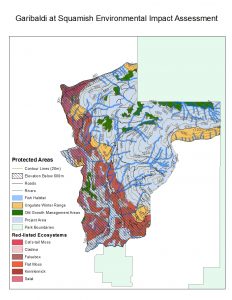
In order to better understand the issues, I have created a map from data acquired from DataBC regarding ungulate inhabitance in the area, old growth forest areas, fish habitat, and rivers. I have overlaid these areas on a map of the project area in order to highlight areas that contain animal and forest area at risk, with the areas of overlap representing critical habitat.

With 31.79% of the project area being below 600 meters in elevation, we see this area as being ruled out. However, sensitive areas that occur below 600 meters largely exted to about 800 meters. At this elevation, we see many red-listed ecosystems, resulting in project unfeasibility below this elevation. Above 800 meters, we see some old grown areas and winter ungulate inhabitance, but the project becomes much more feasible above 800 meters. Overall, the percentage of the project area that would directly impact areas of concern is as follows:

Old growth forest – 6.78%

Ungulate areas – 7.89%

Red-listed species area – 24.83%

Fish areas – 15.85

We see the concentration of fish habitat and red-listed species impact occurring below 800 meters in elevation. Thus, the two major concerns above that elevation (and where most ski resort development would occur) are that of old growth management areas and ungulate areas.

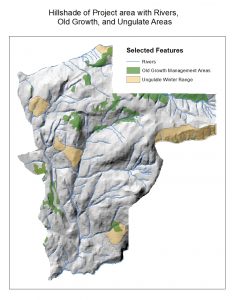
In order to mitigate damage to these areas, I suggest building lifts and other developments to the south-east of the project area. As rivers largely become iced-over in the wintertime, the rivers in this area are of lesser concern. Additionally, I encourage you to build ski lifts between areas of old growth management. This will ensure that the resort can meet skier demand and offer great old-growth skiing, while at the same time preserving these ecosystems.

I also advise you to avoid building parking infrastructure, lodging, and major lift/gondola developments in the areas of red-listed ecosystems. There is the potential for a gondola to fragment these ecosystems, but if built correctly, these effects can be mitigated.

Housing Affordability

A sample of work exploring housing affordability in Vancouver:

dataclass_fin2

If I were a journalist, I would likely choose the manual breaks method. This method would be very easy to communicate to readers, and they would likely understand the message I am trying to get across. I might alter these breaks a little bit, but as far as ease of communication the round numbers of manual breaks offer an advantage.

As a real estate agent, I would choose the equal interval method, as there is much more information surrounding the cost of housing around UBC. This would give the client a better idea of exactly where to look based on their price range.

housecostvo_fin2

Environmental Impact Assessment – Ajax Mine, Kamloops, BC

For our final GIS project, myself along with 2 colleagues examined the proposed Ajax Mine in Kamloops, BC. We set out to perform an environmental assessment on the mine and determine whether or not the project should be approved from an environmental standpoint. Throughout the project we analyzed wind patterns in conjunction with potential dust and sediment transport, as well as possible acid contaminant spillage into surrounding waterways.

Our group was able to effectively complete the project by splitting up tasks that we could perform on our own (such as locating data sets), and then coming together to perform analysis as a group in ArcGIS.

Throughout the project it was interesting to see how you can take separate data sets and bring them together into one cohesive model. We were able to identify rivers that were particularly at risk, as well as parts of the City of Kamloops that might be susceptible to dust pollution. One aspect that I think we could have done better is plan out exactly what analysis we were going to perform at the end of the mapping process. While we did have an idea of where we wanted to go with the project, it would have been useful to have a list of specific ArcGIS functions that we were going to utilize throughout, rather than simply applying the functions we saw fit at the time.

I also learned that publicly available data specific to a particular issue can be hard to find. This led us to take advantage of a number of different data sets in order to cross-reference accuracy and content.

GIS Labwork

  1. Obtained a general understanding of integrating spacial data with ArcGIS in order to produce analysis concerning geographic phenomena.
  2. Explored various projection methods using ArcGIS to better understand the ways in which we take earth’s physical geography and represent it using software.
  3. Used ArcGIS to combine and generate useful information concerning zones throughout Vancouver that are susceptible to potential tsunamis.

Notable Tsunami Hazard Areas in Vancouver

Vancouver's Tsunami Hazard Areas

Created using ArcGIS in order to answer a few key questions regarding Tsunami Hazard Areas in Vancouver:

Q: What percentage of the city of Vancouver’s total area is under danger?

A: Total Vancouver Area: 131,033,339 Sq. Meters

Total Area Vancouver Danger Zone: 20,314,806 Sq. Meters

Total Percentage of Vancouver’s area that lies within Hazard Zone: 15.5%

I obtained these numbers through combining spacial attributes into layers and examining attributes for each layer corresponding to potential tsunami threat. This examination produced a number of useful statistics relating to both the total area of Vancouver and the area that lies within hazard zones.

Q: List the healthcare and educational facilities within the Vancouver danger zone.

A: Education in the Danger Zone:

ST ANTHONY OF PADUA

ECOLE ROSE DES VENTS

HERITAGE 3R’S SCHOOL

VANCOUVER MONTESSORI SCHOOL

FALSE CREEK ELEMENTARY

EMILY CARR INSTITUTE OF ART & DESIGN (ECIAD)

HENRY HUDSON ELEMENTARY

ST JOHN’S INTERNATIONAL

ST FRANCIS XAVIER

INSTITUTE OF INDIGENOUS GOVERNMENT (IIG)

Health Care in the Danger Zone:

FALSE CREEK RESIDENCE

BROADWAY PENTECOSTAL LODGE

COAST WEST COMMUNITY HOME

YALETOWN HOUSE SOCIETY

VILLA CATHAY CARE HOME

I came up with these facilities through creating a new layer within ArcMap combing spacial data of hazardous locations with the locations of Health Care and Educational facilities. The overlapping area provides useful information concerning facilities within the danger zone.

Spam prevention powered by Akismet