Rental Housing Affordability of Four Canadian Universities
My team of three chose to compare rental housing affordability surrounding four Canadian universities: UBC, the University of Alberta, McGill University and York University. Our Abstract highlighting our process and main findings can be found at the end of this post, along with a sample of our maps.
See our complete report and all maps here: GEOB 270 Final Project
We had three main goals for this project:
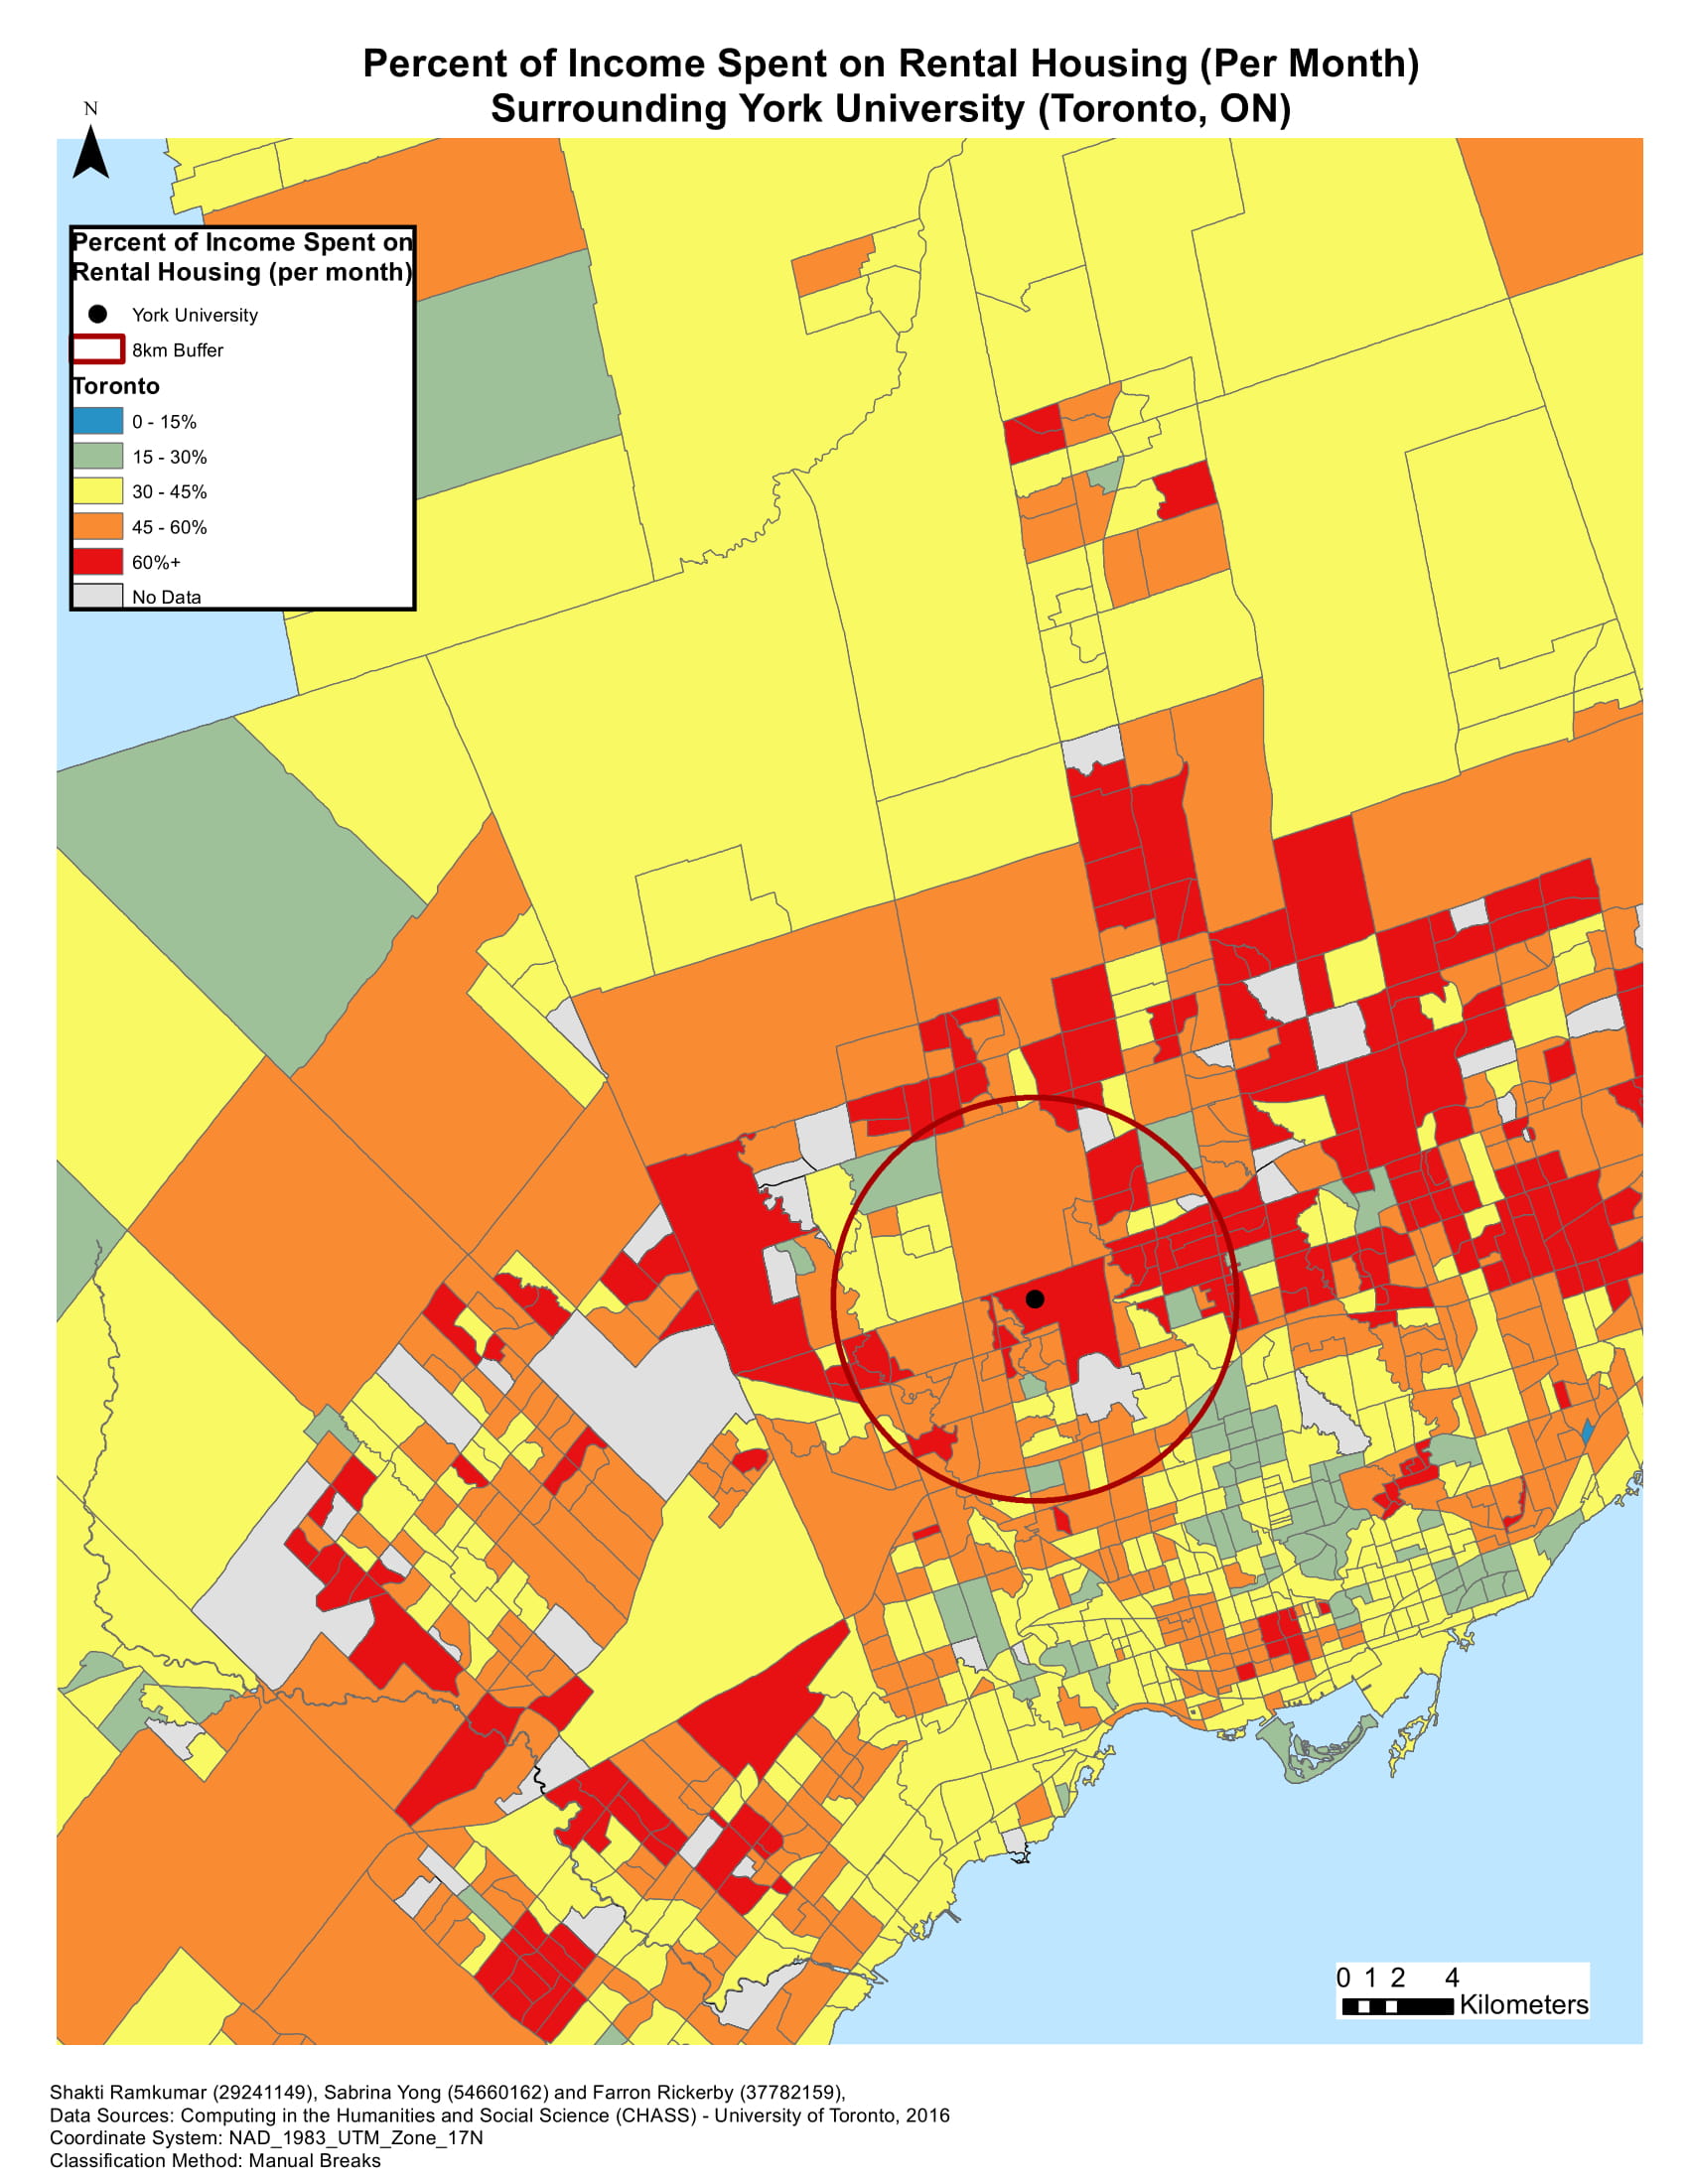
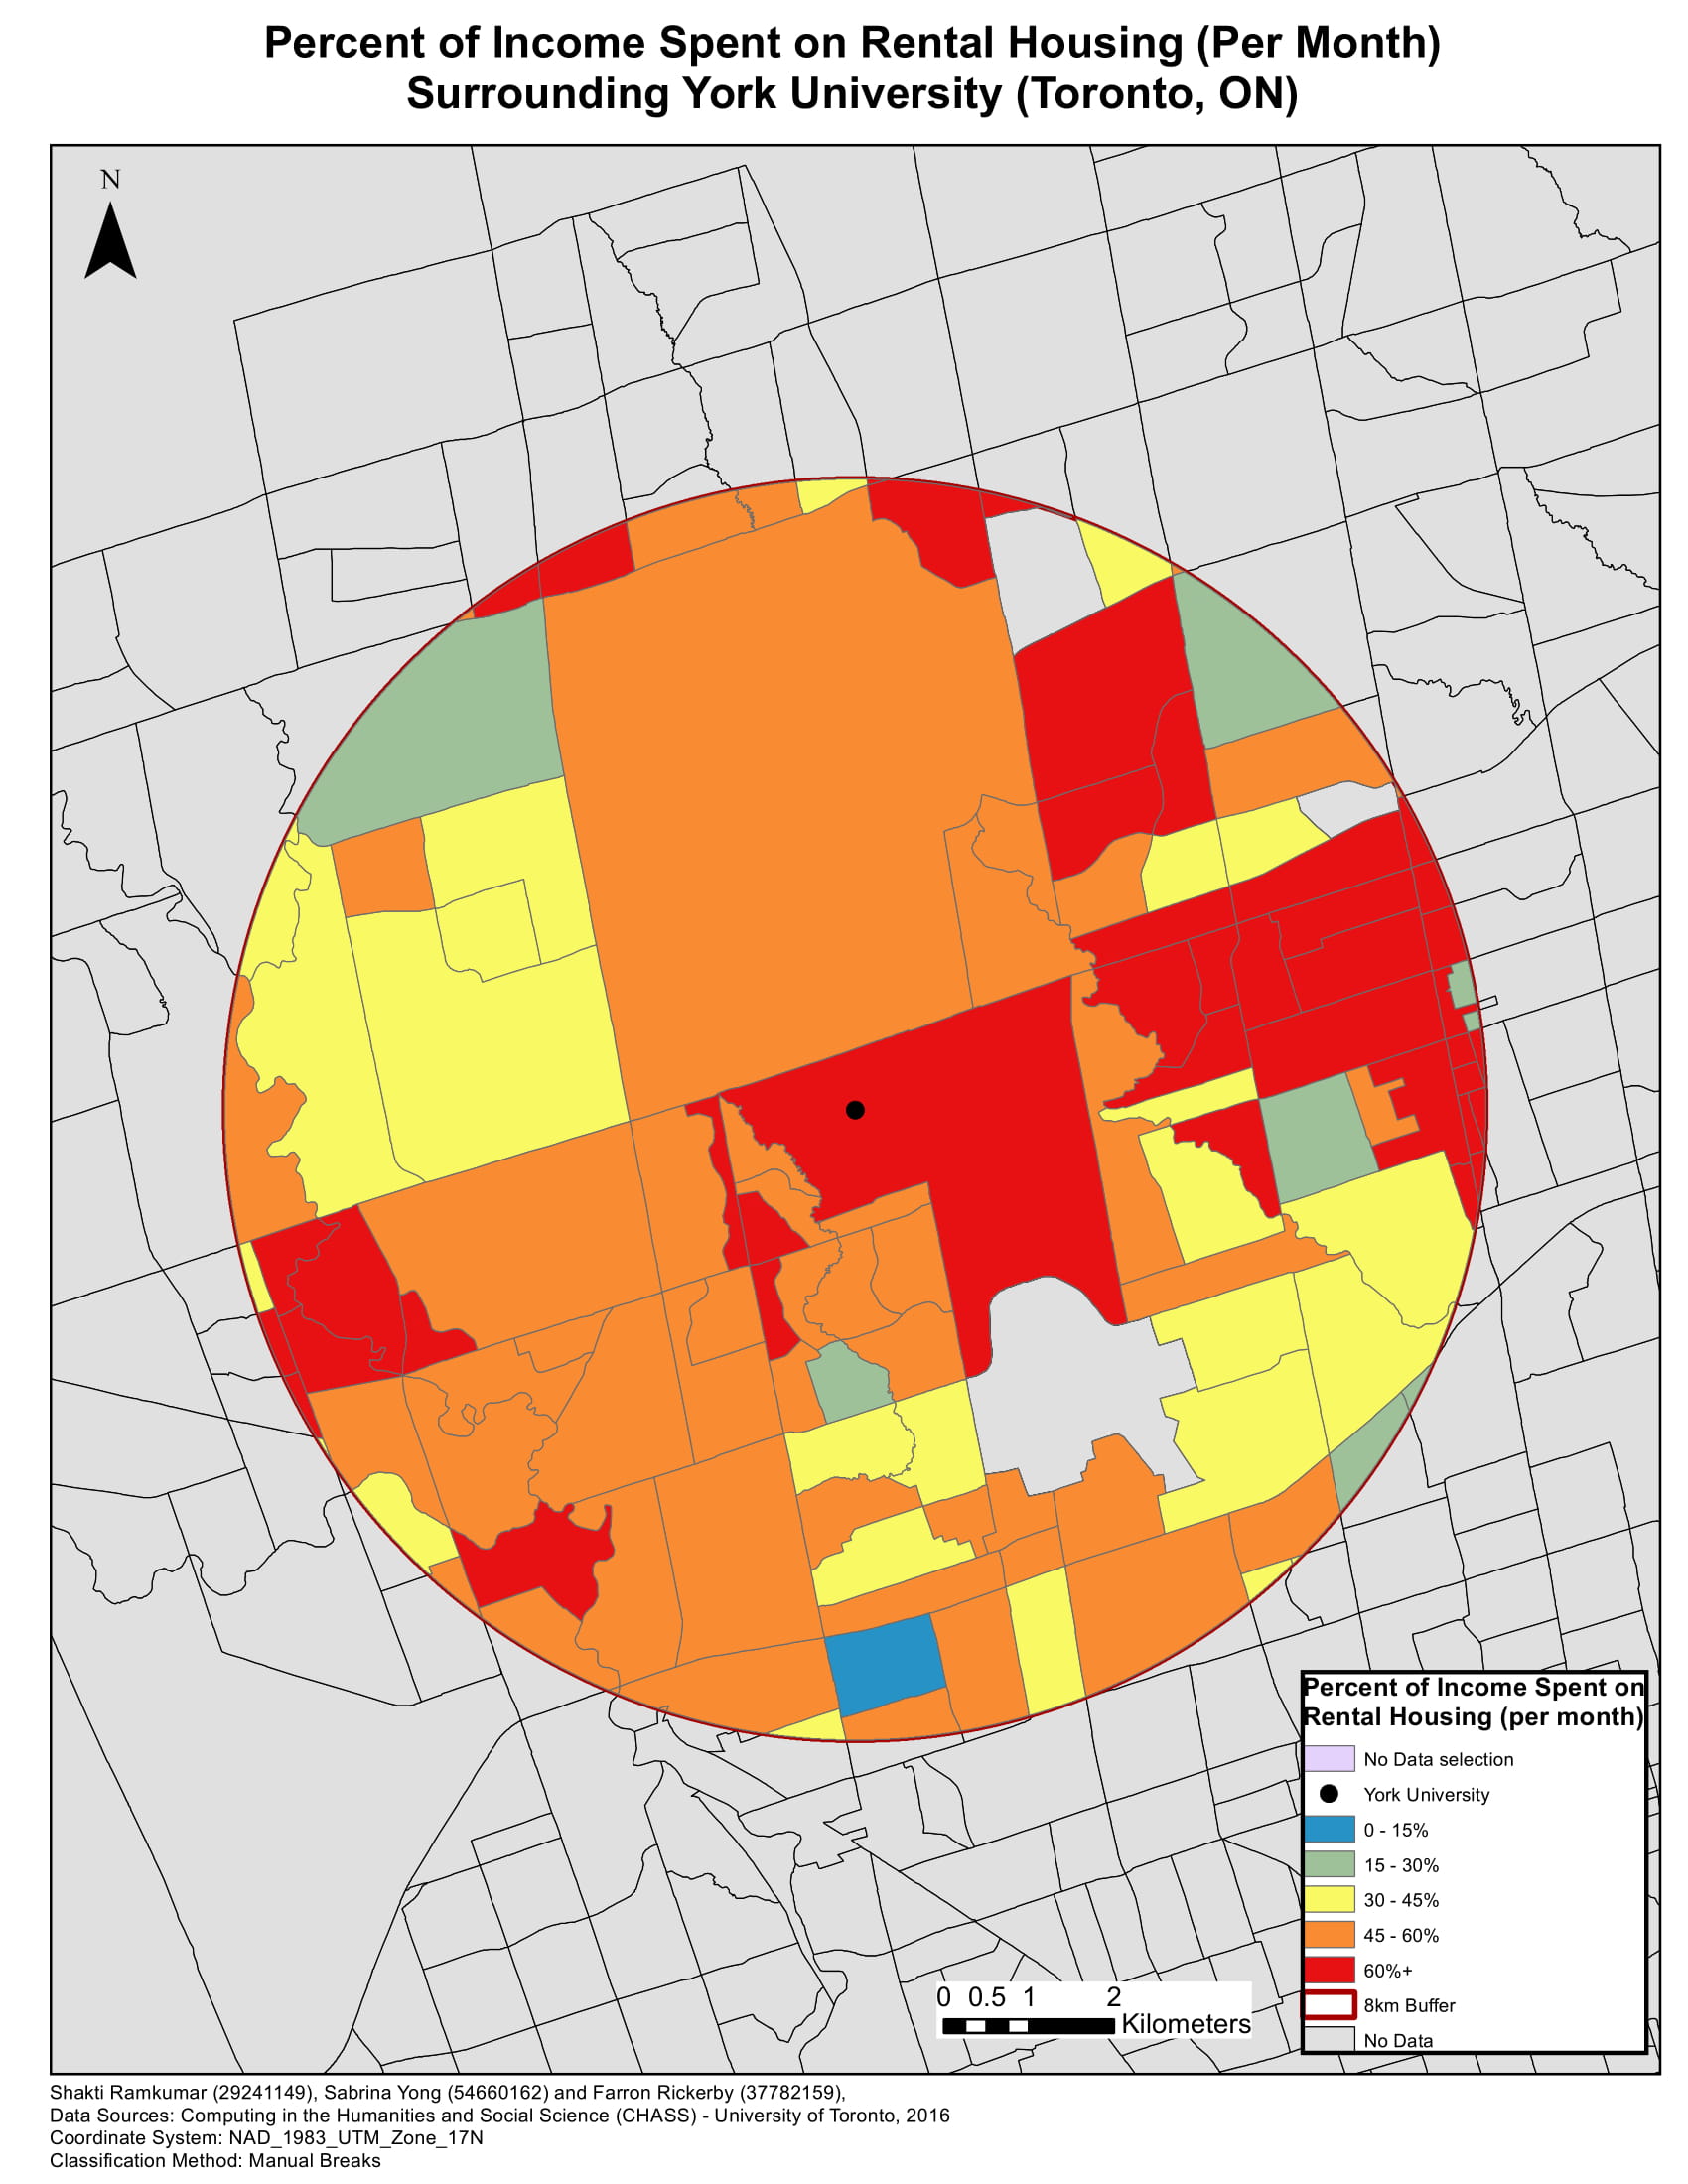
- Use GIS to visually display housing affordability, which we defined as a ratio of median income to median cost of rented dwellings.
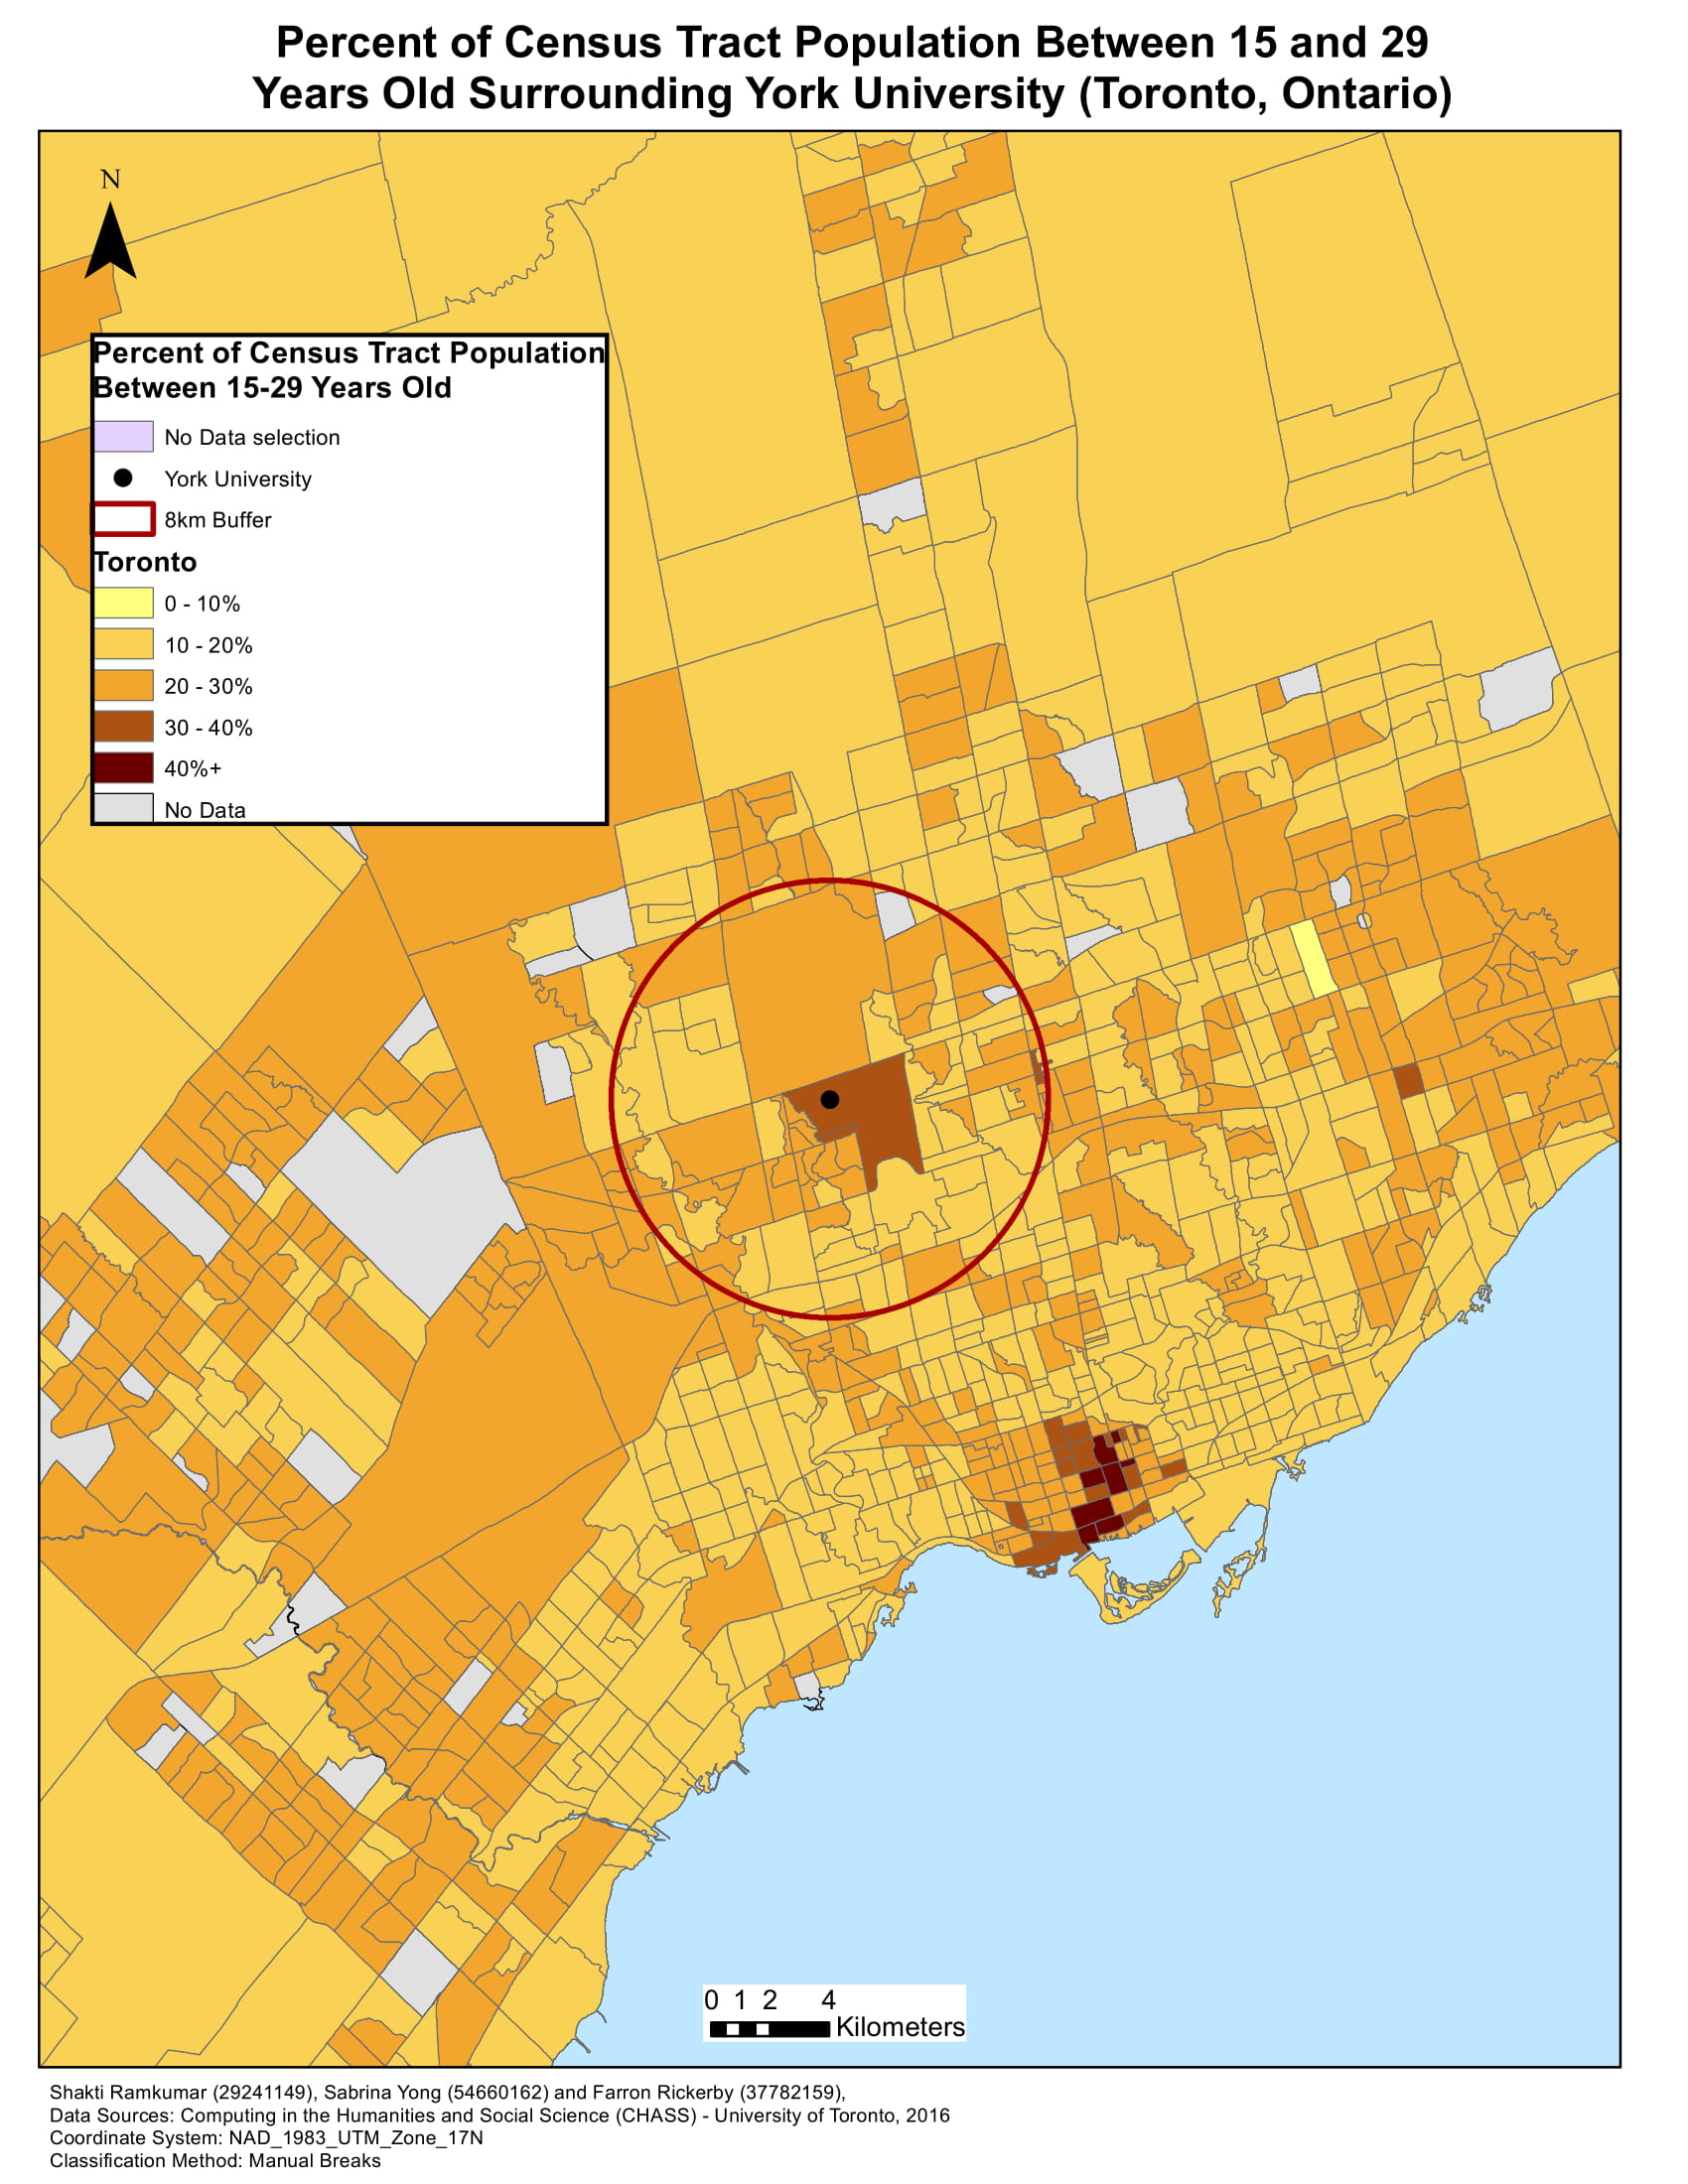
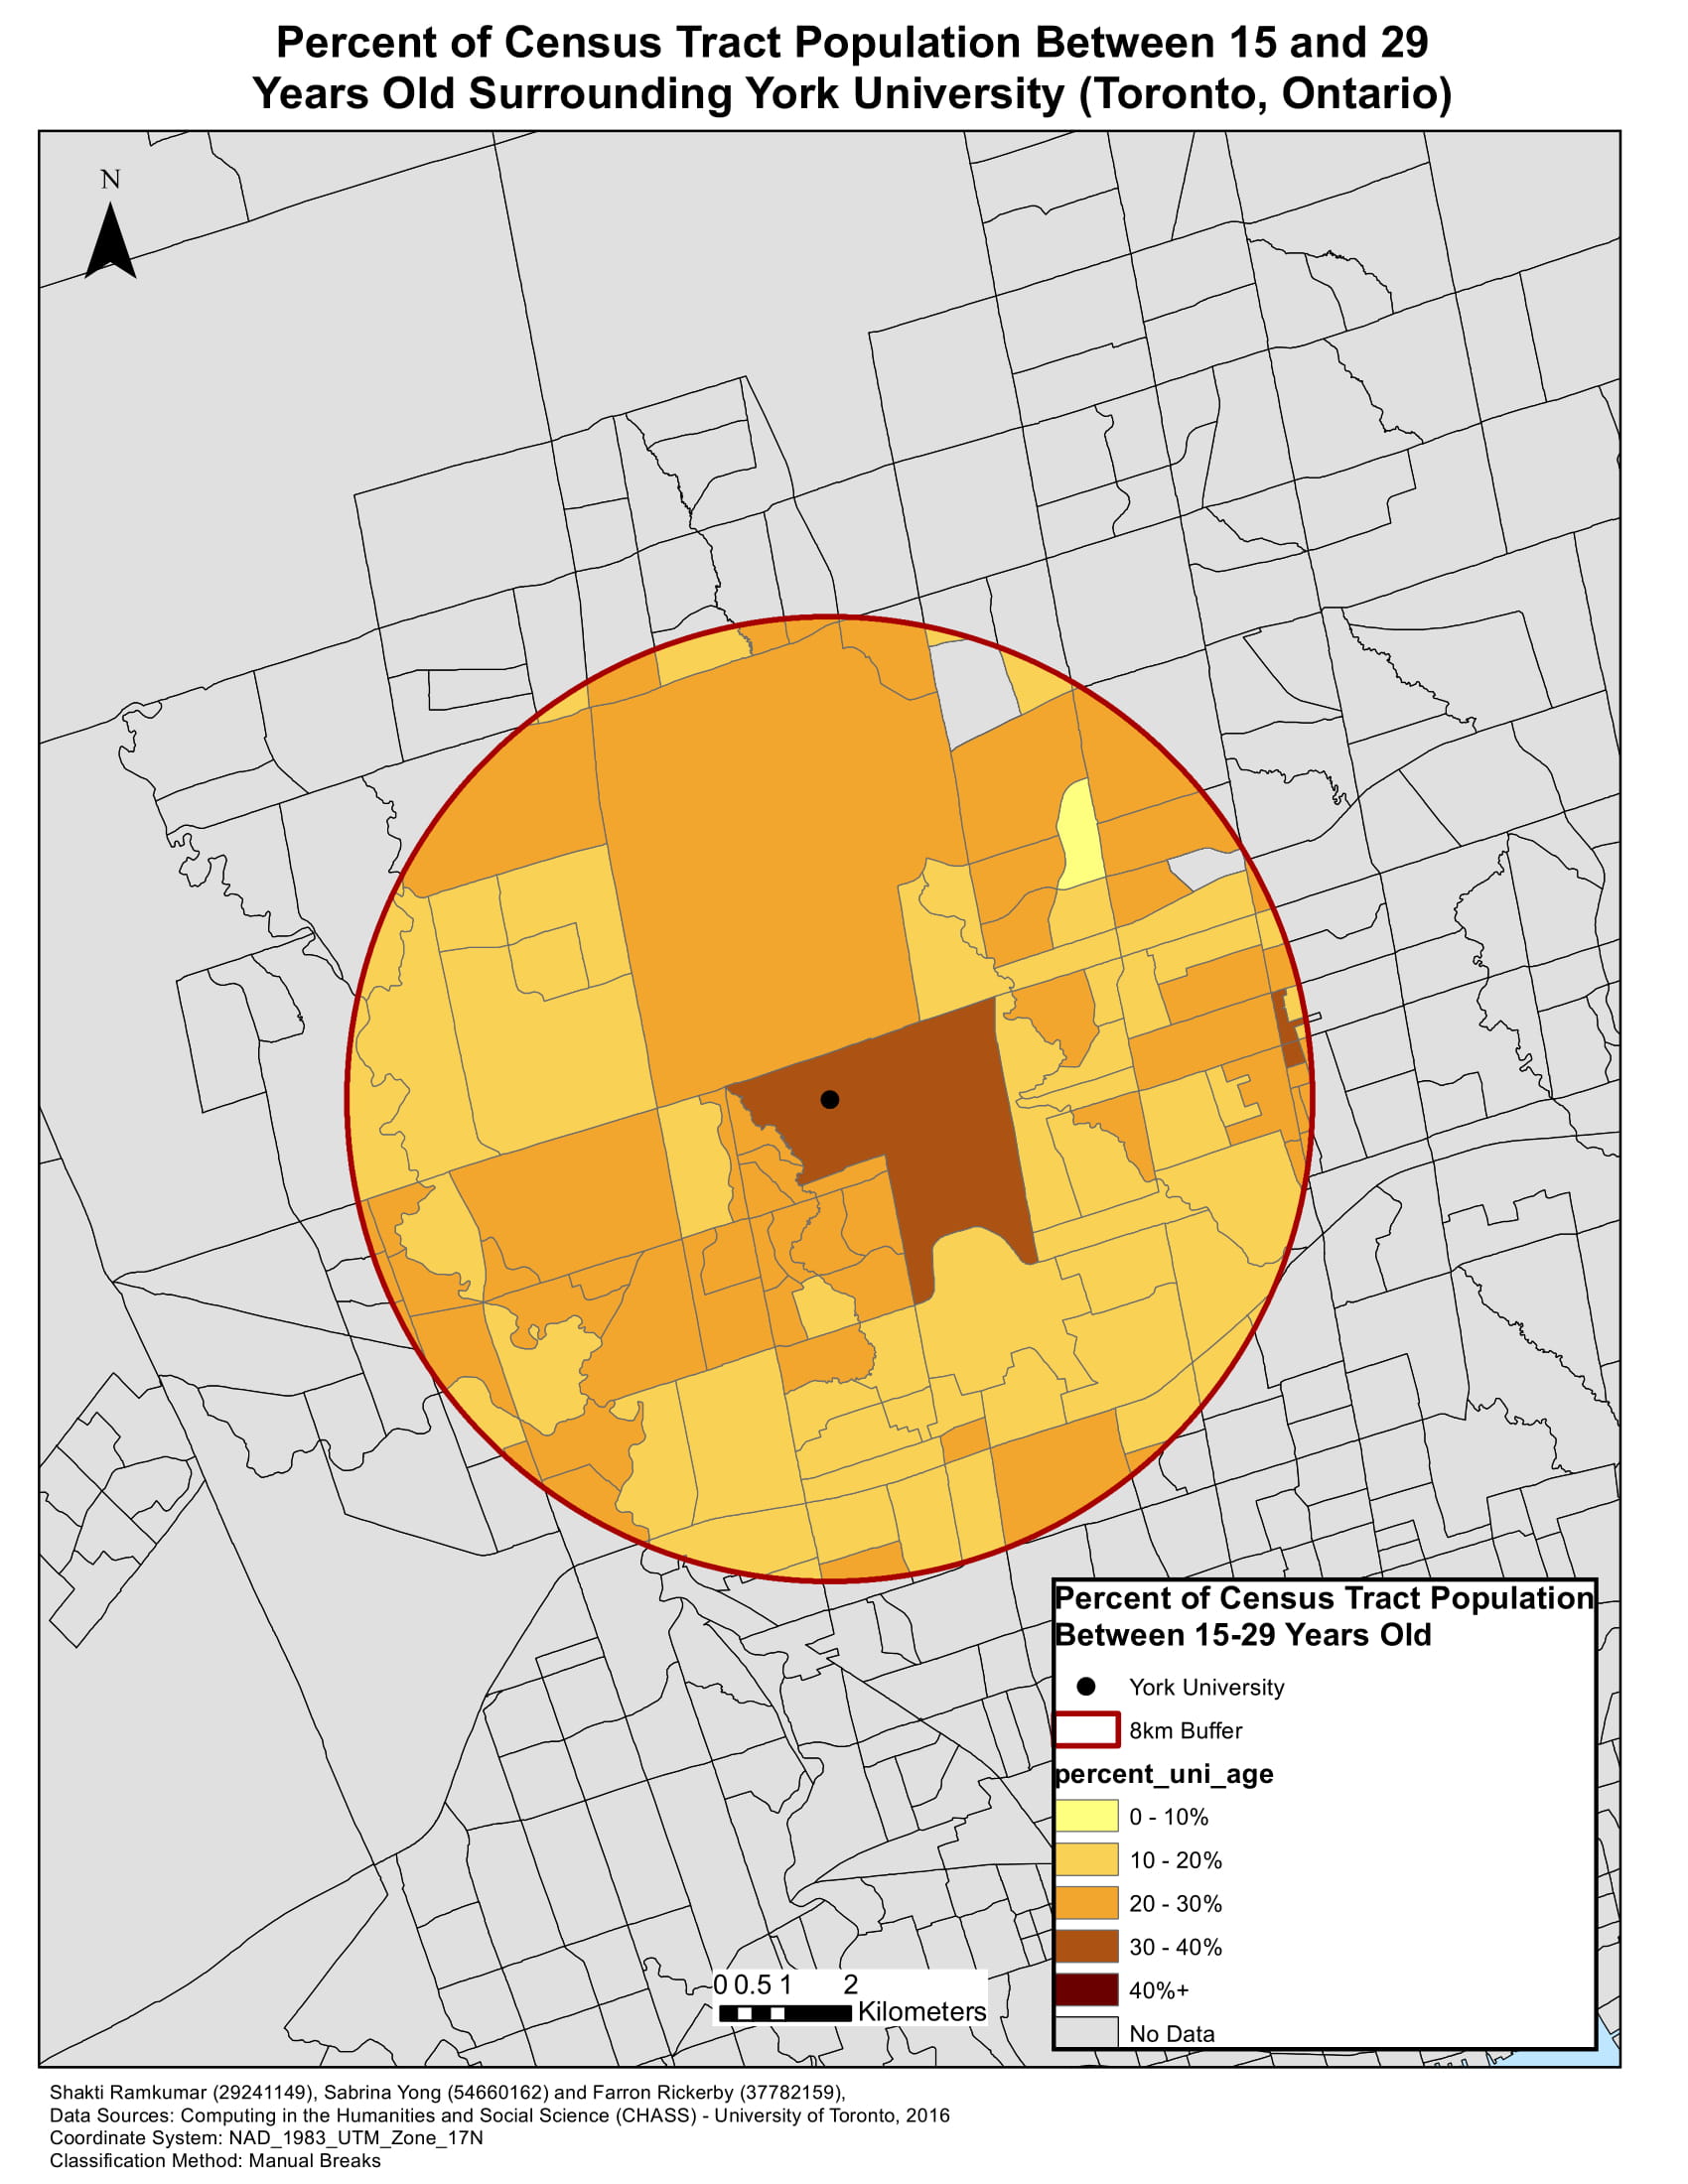
- Use GIS to display concentrations of youth throughout the city, to determine if there was a correlation between areas with unaffordable housing and high concentrations of young people.
- Compare average tuition costs at each of the four universities, to get a sense of overall affordability at each university.
Project Management
All three of us were involved in the data acquisition, GIS analysis, and report writing parts of the project. We began by meeting in the lab to start to work on one of the cities together, where we were able to make decisions about which census data to download, how to set up our maps, and finalize the scope of our GIS analysis. After this initial meeting, we each worked independently on affordability and age maps for one particular city, though often at the same time in the lab. I found this process to be efficient, as we could ask each other questions and troubleshoot, and also ensure that we were following similar procedures in terms of map design so that the four cities’ maps could be compared.
Learning
This topic was interesting for me as someone who has experienced both living on campus and doing the 1 hour+ commute that so many UBC students do. Housing affordability was also the hot topic in the past municipal election, including affordability challenges for young people – I even wrote about it for the Ubyssey. One thing I learned by doing this project is to always take a more critical look at the many statistics, maps and charts used to advocate for any point of view, which I realized I did not do at all when following the debates during the election. For example, some visuals that appeared during the election claimed it was a ‘buyers’ market’ based on falling home prices, while others warned of rapidly increasing unaffordability. Having to wrestle with questions on how to measure affordability and how to draw accurate conclusions from data has taught me to sift through data and visuals more critically.
We also learned that there is a data gap to accurately compare university affordability, because we only had access to Census data for median income and concentrations of youth aged 15-29 for the entire Vancouver population. University surveys (when they were available) often used uneven criteria or did not directly collect the data we were looking for, so there is a data gap that we stumbled upon through completing this project. This data gap and challenges in comparing university affordability could of interest to various departments at UBC – for example, the AMS, which conducts an annual Academic Experience Survey and has a mandate to advocate for affordability, or UBC’s Planning department, which has studied Student Housing Demand.
Some interesting GIS analysis techniques we used was in creating our ‘Buffer Zone’ maps where we analyzed affordability and age distribution within 8km buffers surrounding each university and had to clip census data to the buffers, and also clearly show in our map design that we are only looking at a specific selected area.
Managing data within the team was a challenge, as we often worked on different components of the project at different times. We settled on uploading our complete project file to Google Drive at the end of each work session, which was effective, but quite a slow process. In future, I would advise creating a system to track changes and versions by 1) a naming convention for .mxd files that indicates its edit date or version, 2) noting which parts of the project were completed at what time in a shared Google Doc and 3) storing up-to-date project files on a USB, rather than relying on the H: drive or Google Drive.
Abstract
This project compares the rental housing affordability of four Canadian universities: The University of British Columbia (UBC) (Vancouver, BC), University of Alberta (UA) (Edmonton, AB), McGill University (MGL) (Montréal, QC) and York University (YU) (Toronto, ON). A Geographic Information System (GIS) was used to visualize rental housing affordability surrounding each university, defined in this project as the ratio between median income and median cost of rented dwellings. Specific attention is given to areas within 8 km of each university, as research shows many students prefer to live within this commuting distance. To compare the four cities, maps were created to display the concentration of university-aged students (defined broadly as ages 15-29) in each city compared to the wider population. The spatial distribution of university-aged students and rental housing affordability in those areas was compared. Average annual tuition costs at each university were also compared, as an additional factor influencing overall university affordability. This analysis shows that McGill is the most affordable university to attend in terms of rental housing affordability, followed by the University of Alberta, and York University, with the University of British Columbia being the least affordable.
An example of the four maps produced for each city.
Click to enlarge.
York University Affordability Map – full city (Toronto), and within the 8 km buffer zone surrounding the university
York University Age Map – concentration of people aged 15-29 within the full city, and within the 8 km buffer zone surrounding York University