In this project, I created four maps to highlight the areas in Metro Vancouver that face a risk of flooding or a storm surge during a potential extreme weather event. The flooding danger zone selected was all areas that lie below 8 m elevation, up to 1 km inland from the shoreline. The third and fourth maps also display roads and schools that would be affected by potential flooding, as well as the site of the new St. Paul’s hospital. To highlight these zones on the map, I used digital elevation models (DEM) data for Metro Vancouver and specifically the False Creek area represented as a raster, and vector data layers that displayed the Metro Vancouver shoreline, roads, and schools.
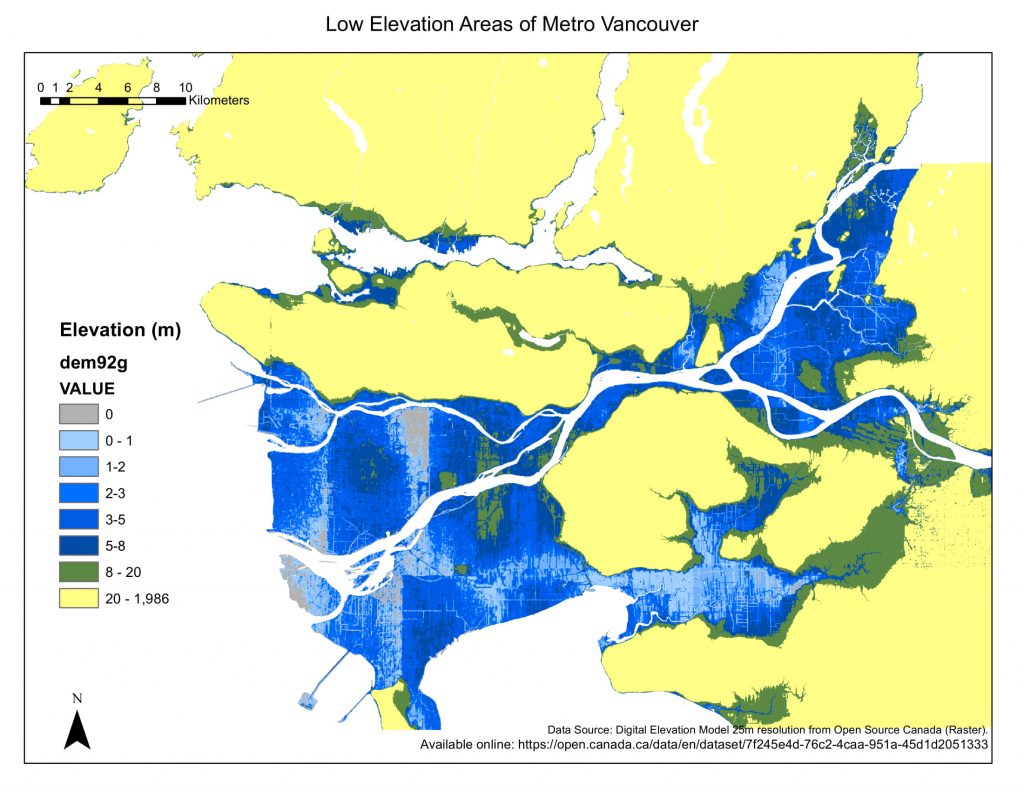
The first map shows all low elevation areas in Metro Vancouver (<8m), created by classifying the DEM raster.
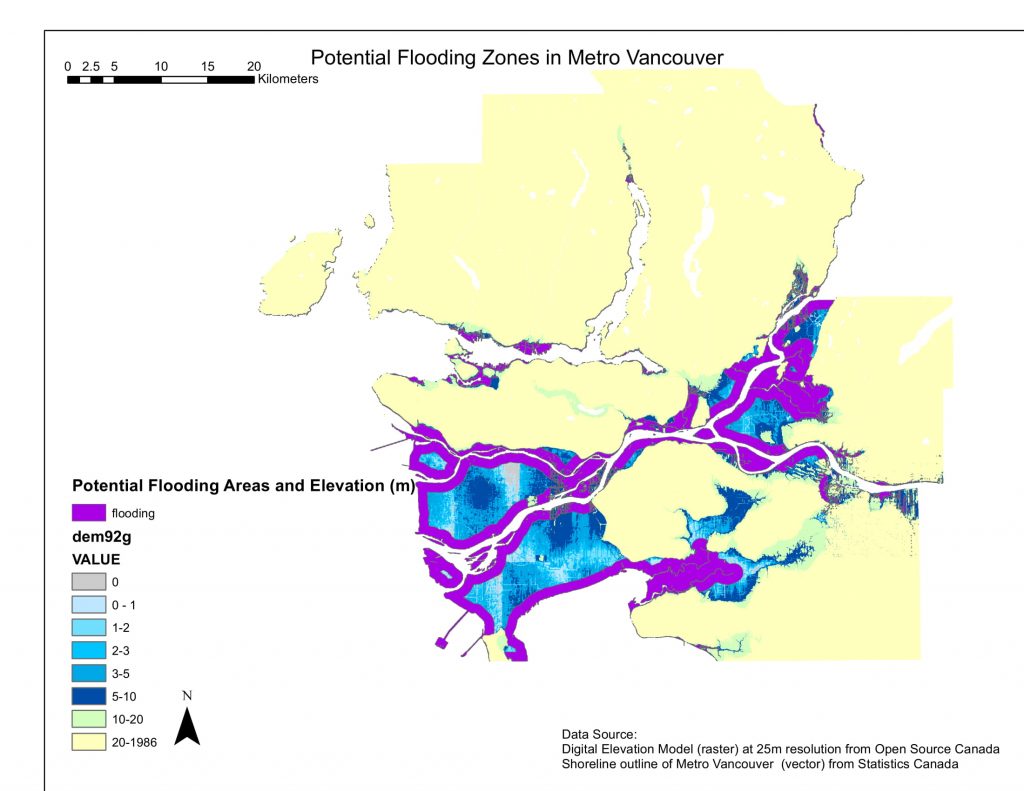
The second map shows potential flooding areas, which are all low elevation areas up to 1 km inland from the shoreline. I created a 1km buffer around the shoreline and conducted a buffer proximity analysis by intersecting the low elevation areas with the 1 km buffer to display areas of potential flooding risk.
The third map highlights the major roads that fall within the flood risk area. I found that nearly 200km of highways and expressways would be affected by potential flooding.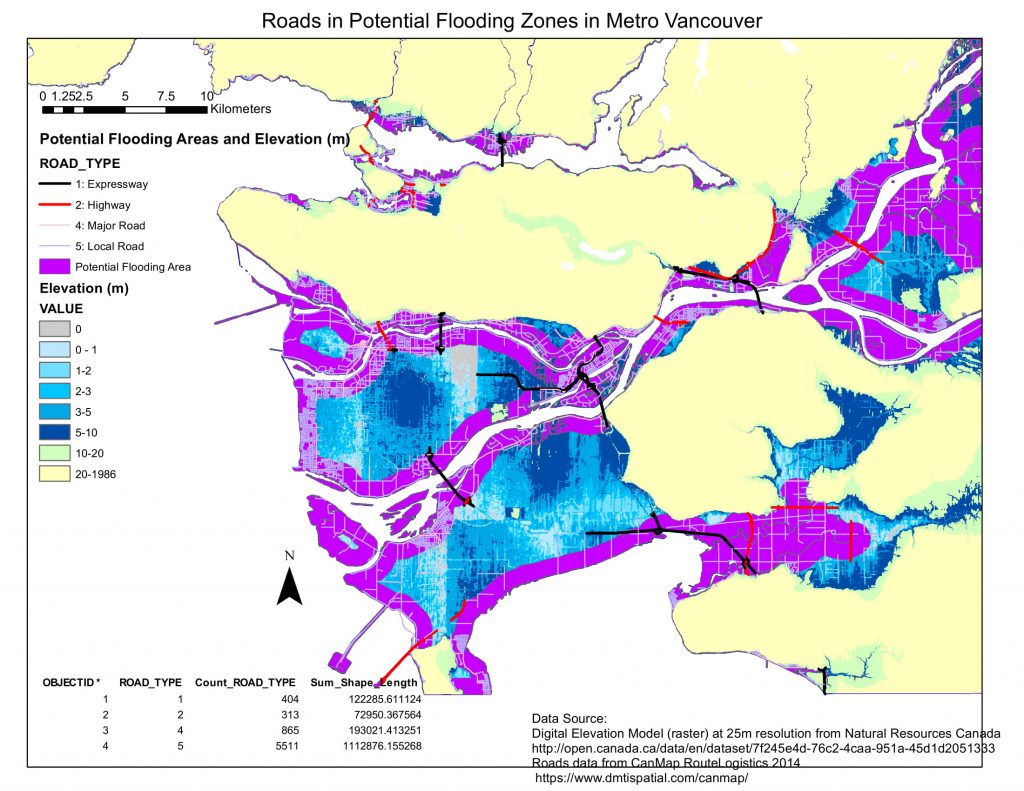 The final map focuses specifically on the False Creek area, highlighting roads and schools in the potential flood risk zone, as well as the proposed location of St. Paul’s Hospital.
Schools in flood zone:
Columbia College
Crosstown Elementary
Elsie Roy Elementary
False Creek Elementary
Henry Hudson Elementary
Royal Canadian College
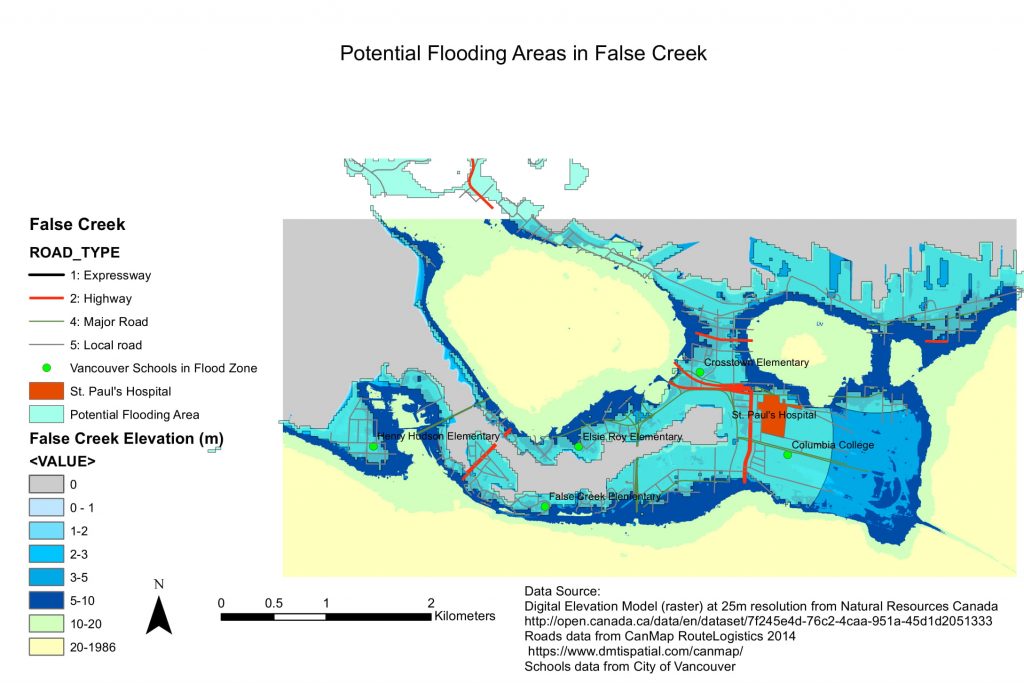
In the fourth map, the Digital Elevation Model used has a higher resolution (smaller pixel size) of 1m, compared to the 25m DEM resolution used for the previous maps. A finer resolution is important in this case, as the 1m DEM map displays more of the variation in elevation and more detailed shoreline features. The differences between 3-10m are more apparent in the DEM file with finer resolution, which may not be necessary when looking at a very large region such as Metro Vancouver or BC, but are necessary when studying a smaller area such as False Creek. Using a coarser resolution DEM could result in error, because it may not precisely highlight flood prone areas on a block or neighbourhood scale.
Accomplishment Statement
In Lab 3, I learned how to work with two different types of spatial data: raster data and vector data. I used Conversion Tools in ArcGIS to convert a raster into a vector in order to identify common information between the two layers. I also isolated relevant sections of data by creating a buffer zone, and querying for certain criteria in the data attribute tables. Finally, I learned how to create new features such as polygons, by using the ArcGIS Editor tool.