Broader Vancouver Conditions
Vancouver’s Current State
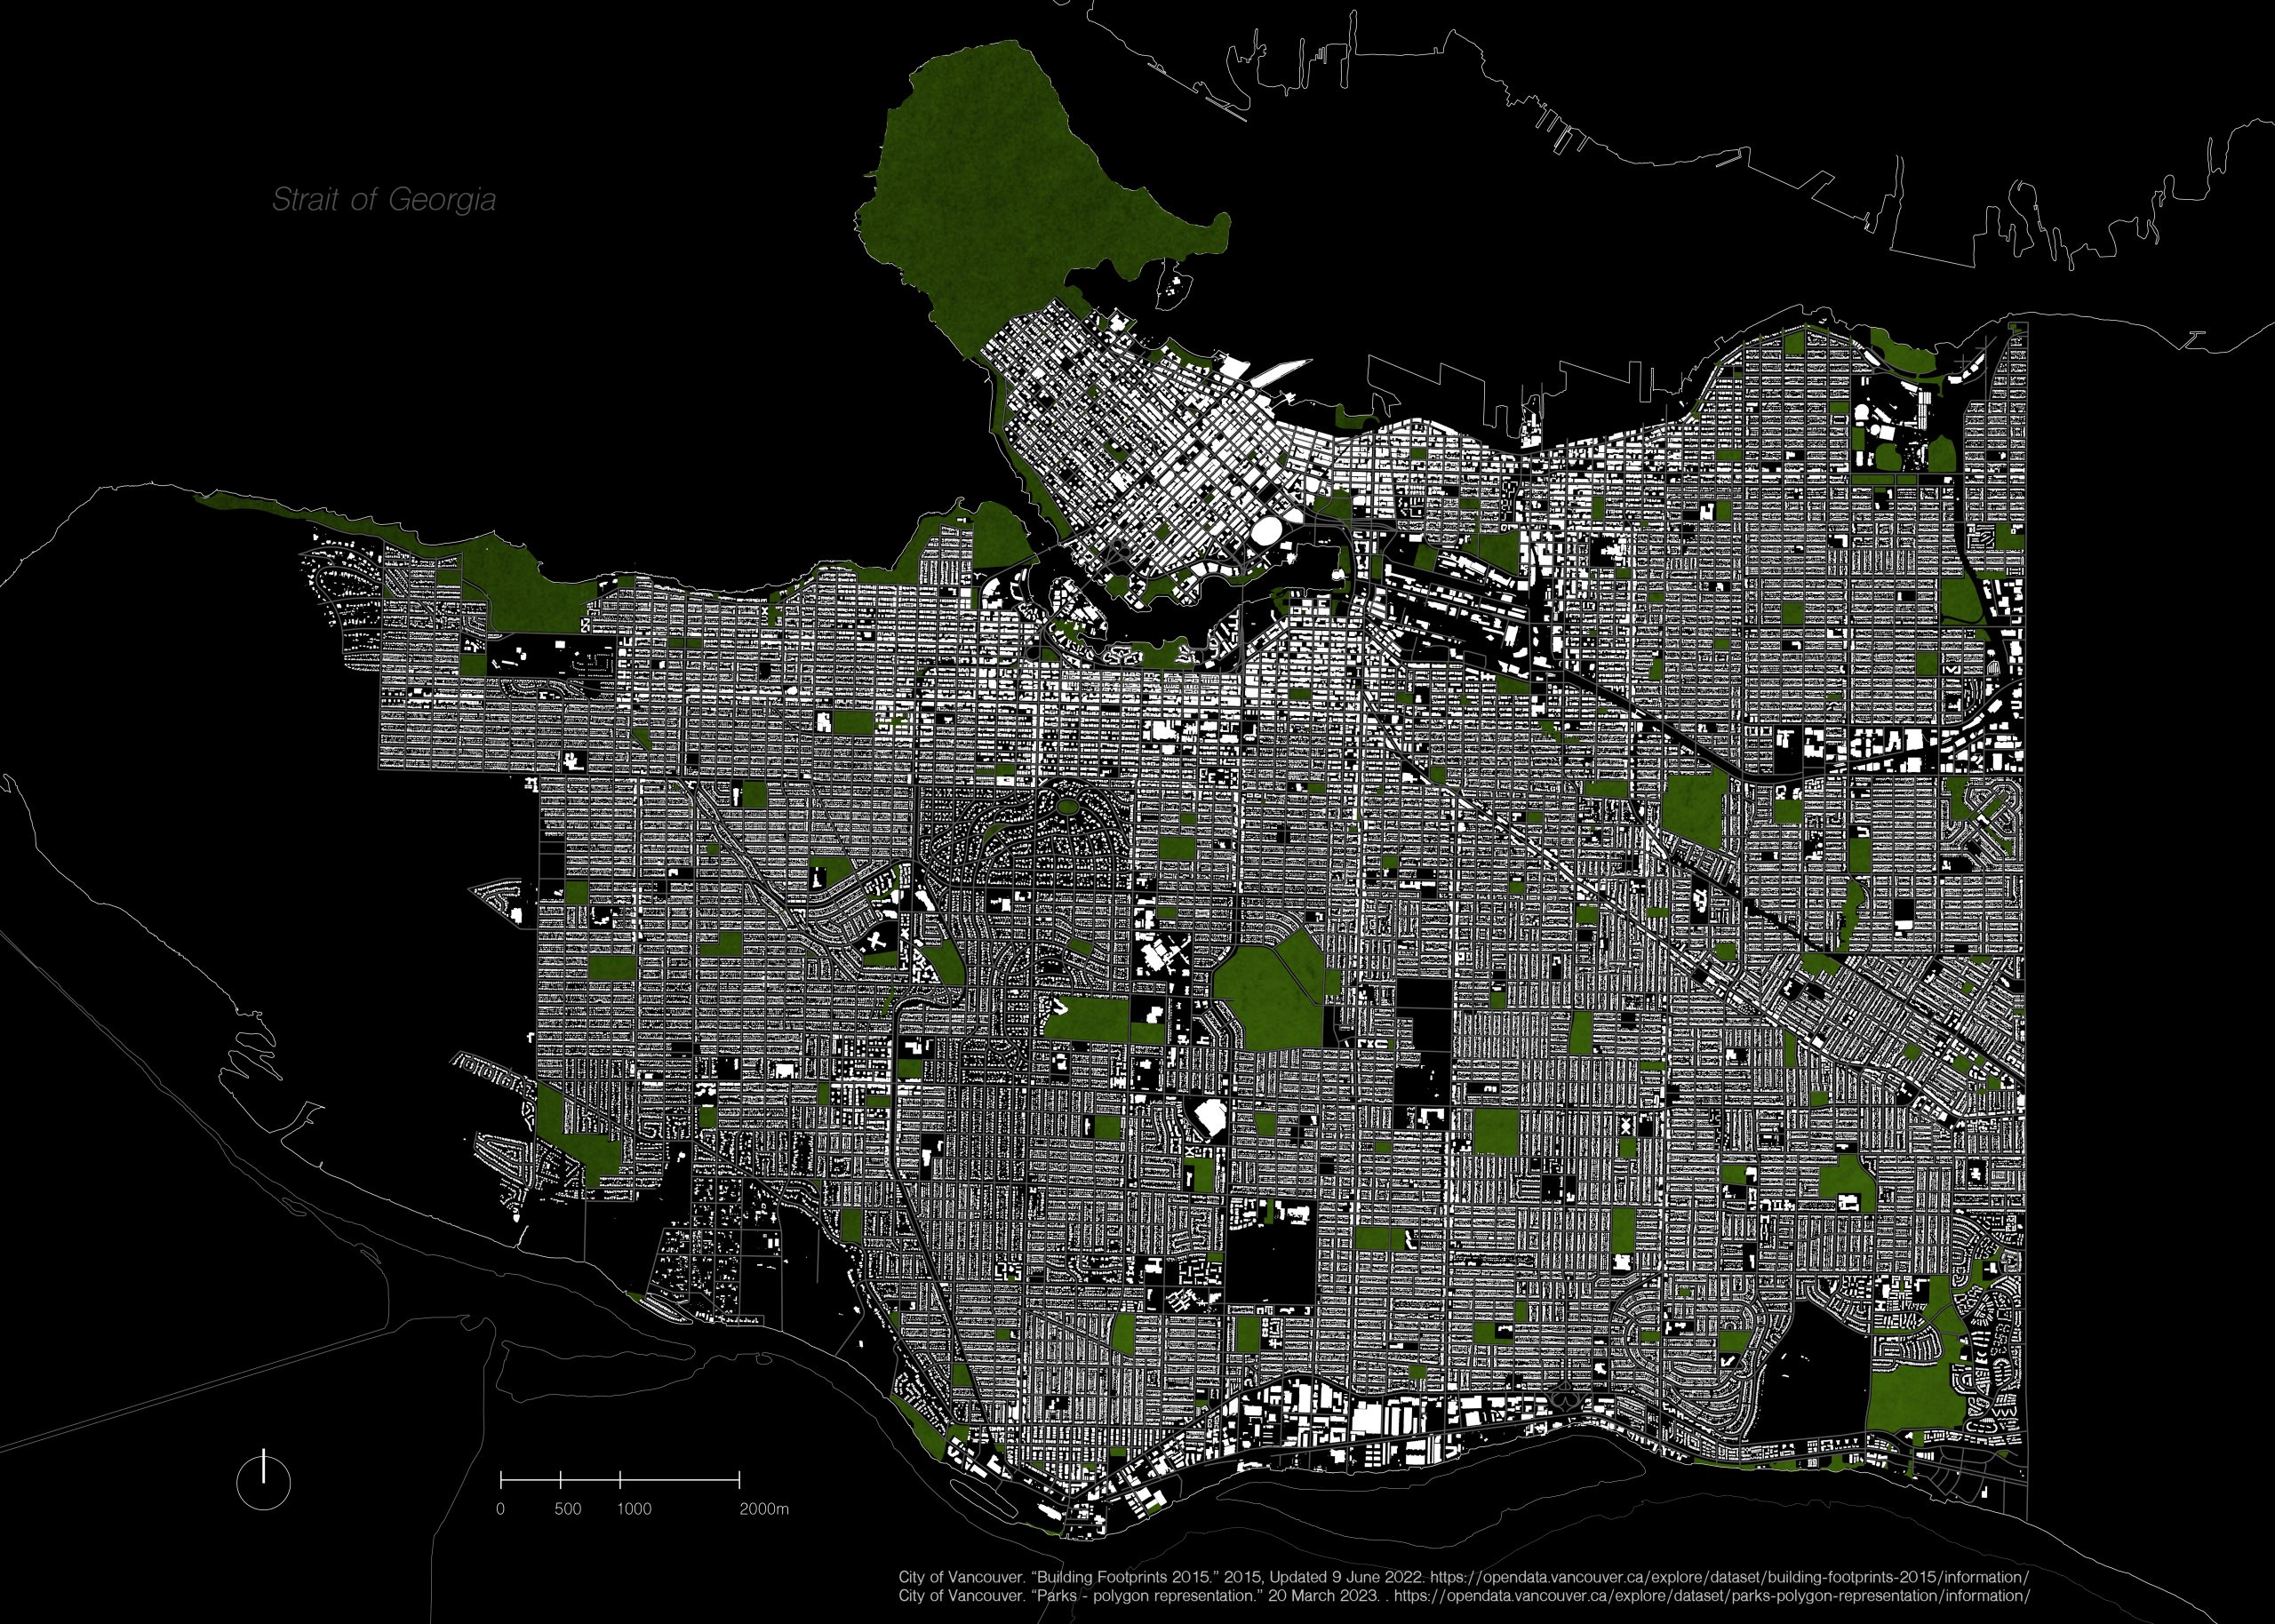
The City of Vancouver has five significant forecasted earthquake scenarios: two distant events (Mw 9.0 Cascadia Subduction Zone event and Mw 7.3 event on Vancouver island) and three nearby events (deep in-slab Juan De Fuca event, Mw 7.3 event in the Georgia Strait, and a Mw 6.5 shallow crustal event in New Westminster) (Scawthorn 53). These earthquakes pose fire, liquefaction, structural, and health risks that could cause losses up to $10 billion (Scawthorn ii). There is a high likelihood of structural failure in the buildings as the city is largely composed of densely spaced wood buildings (Scawthorn 1). In the event of homelessness caused by an earthquake event, a city’s urban greenspaces are a significant shelter space, as evidenced by 1.57 million people sheltering in green spaces after Japan’s Mw 7.9 earthquake in 1923 (Masuda 53). This case displays that not only are urban parks used as shelter, but also serve as a hub for emergency response administration as well as slow the spread of fire. Parks in Vancouver must be designed with these factors in mind as the city is posed in a unique position of vulnerability to earthquake events. It is not a matter of if, but when we will be faced with the consequences of ground motions in our city. Due to the infrequency of palpable earthquake events it is likely that the population will experience a severe panic reaction and display a lack of coordination following the event (Alexander 175). This places even more importance on the efficacy of park design in mitigating life-threatening circumstances by anticipating probable scenarios and based on information found on this site.
Vancouver’s Floodplain
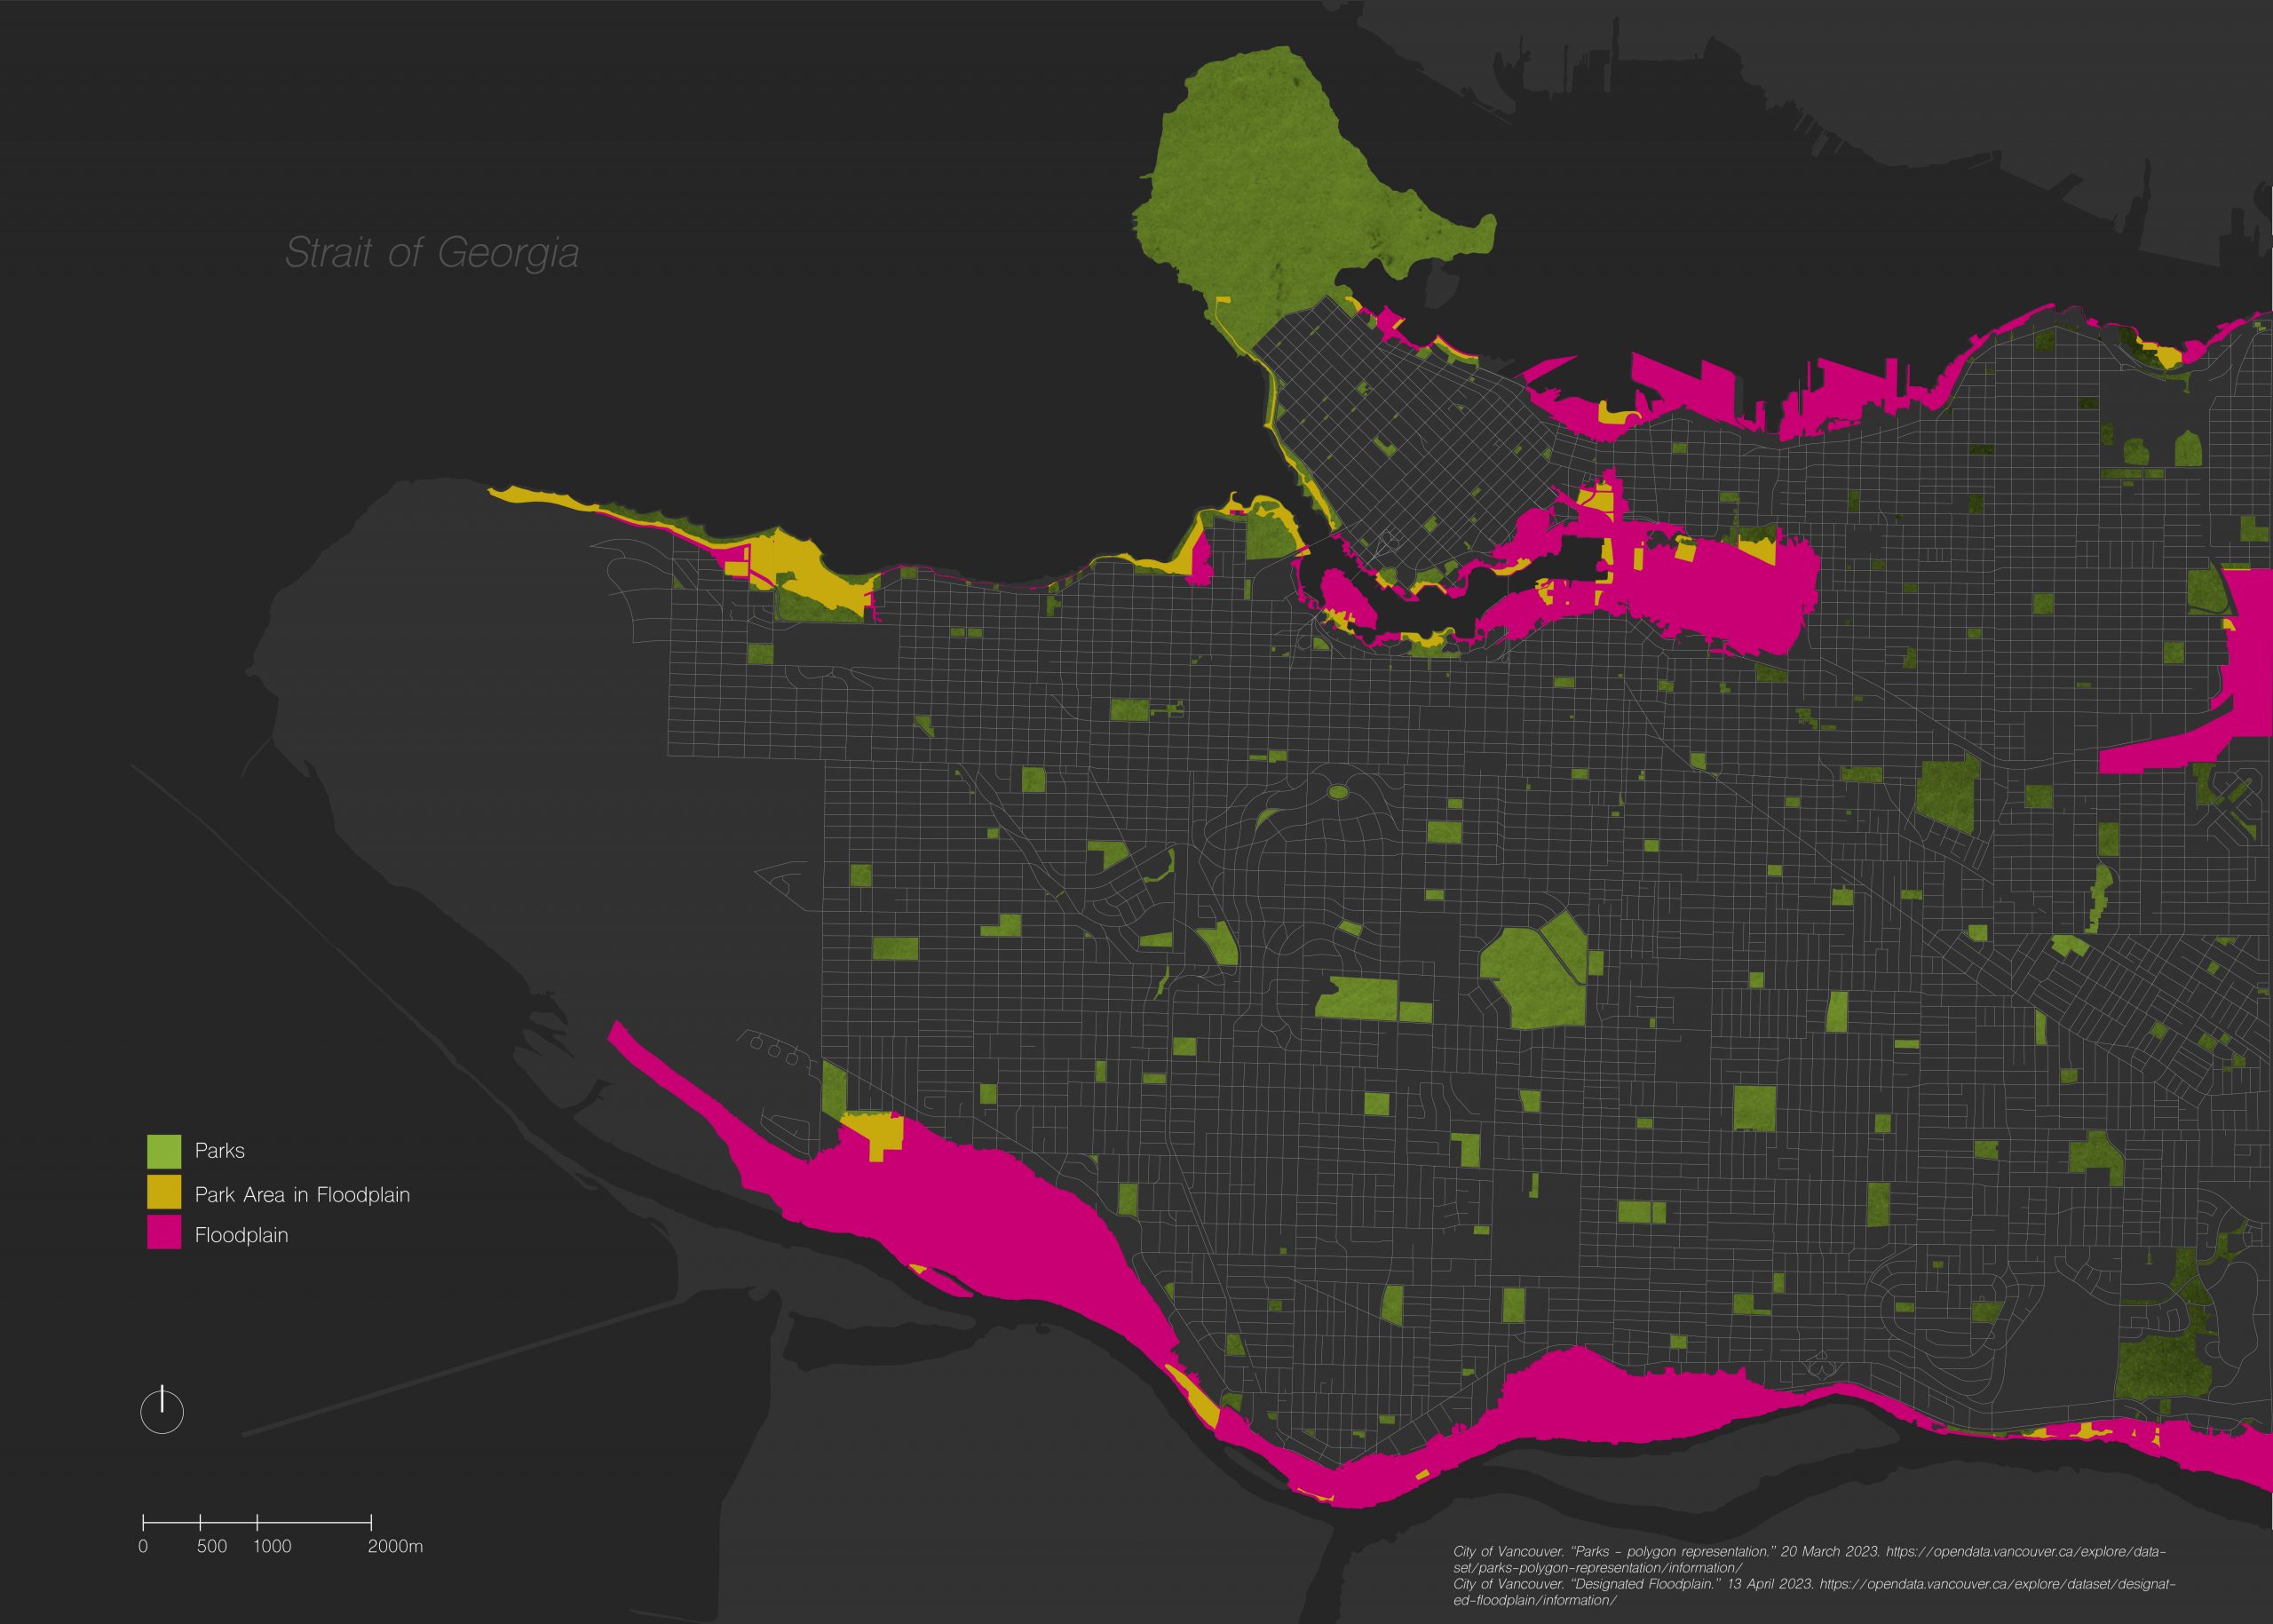
The floodplain is an important design decision to consider as it encompasses all low-lying areas in the city which are prone to flooding during high flow events from an adjacent body of water. The map above highlights the parks residing within Vancouver’s designated floodplain that would require additional design consideration to be suitable for shelter during an aforementioned high flow event.
Tsunami Risk in Vancouver
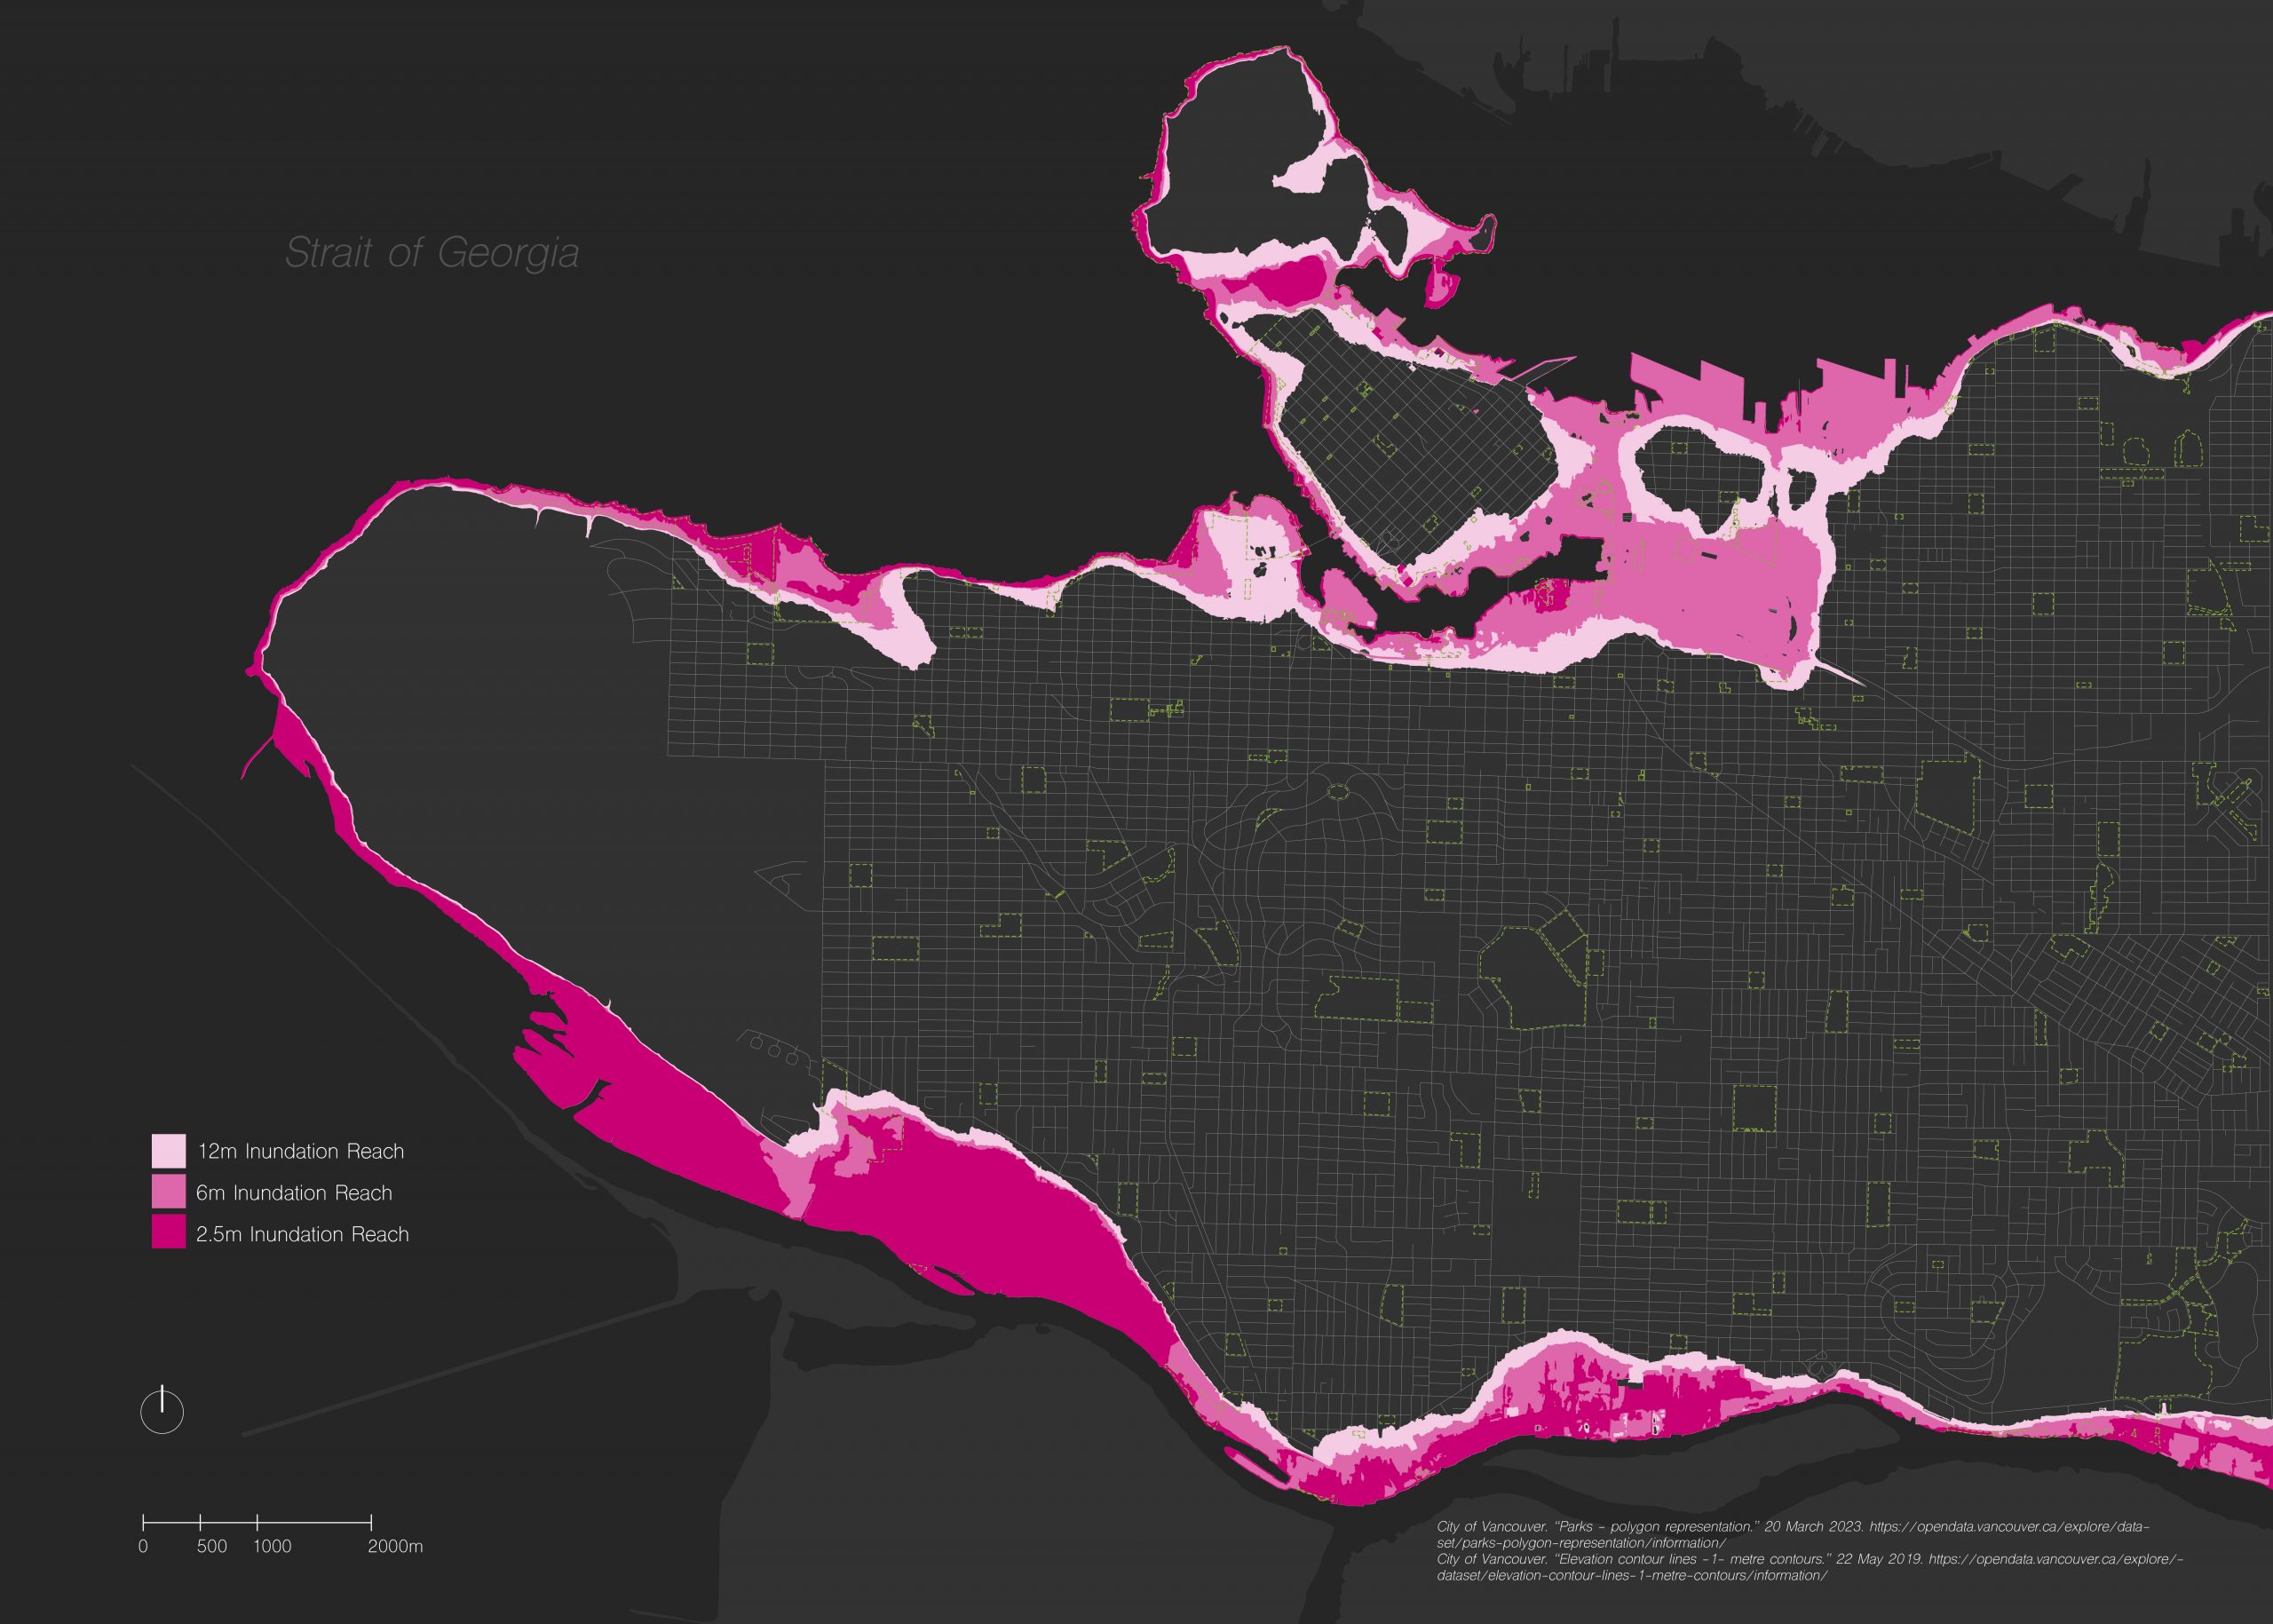
In the event of an earthquake a tsunami will be generated by ground motions underwater, causing risk to habitation beyond coastlines (California Earthquake Authority). Vancouver may be affected by earthquakes in the Strait of Georgia or by sub-marine landslides in the Fraser River Delta as well as earthquakes of great magnitude occurring in the North Pacific Ocean (“Hazards that could affect our city.” Clague et al). The tsunami risk in Vancouver is very low, with about a 1:200 chance of waves ranging from 1.5-2.5 m and no greater than a 1:5000 chance of waves larger than 2.5m occurring annually (Clague et al). The height of waves originating from ground motions in the Cascadia Subduction Zone is largely unexplored, leaving the greatest risk to the city fairly unknown. The map above is modeled based on the forecasted waves of 6m building to 12m that will hit the western coast of Vancouver island in the event of a Mw 9.0 CSZ earthquake (Judd et al).
Liquefaction Risk in Vancouver
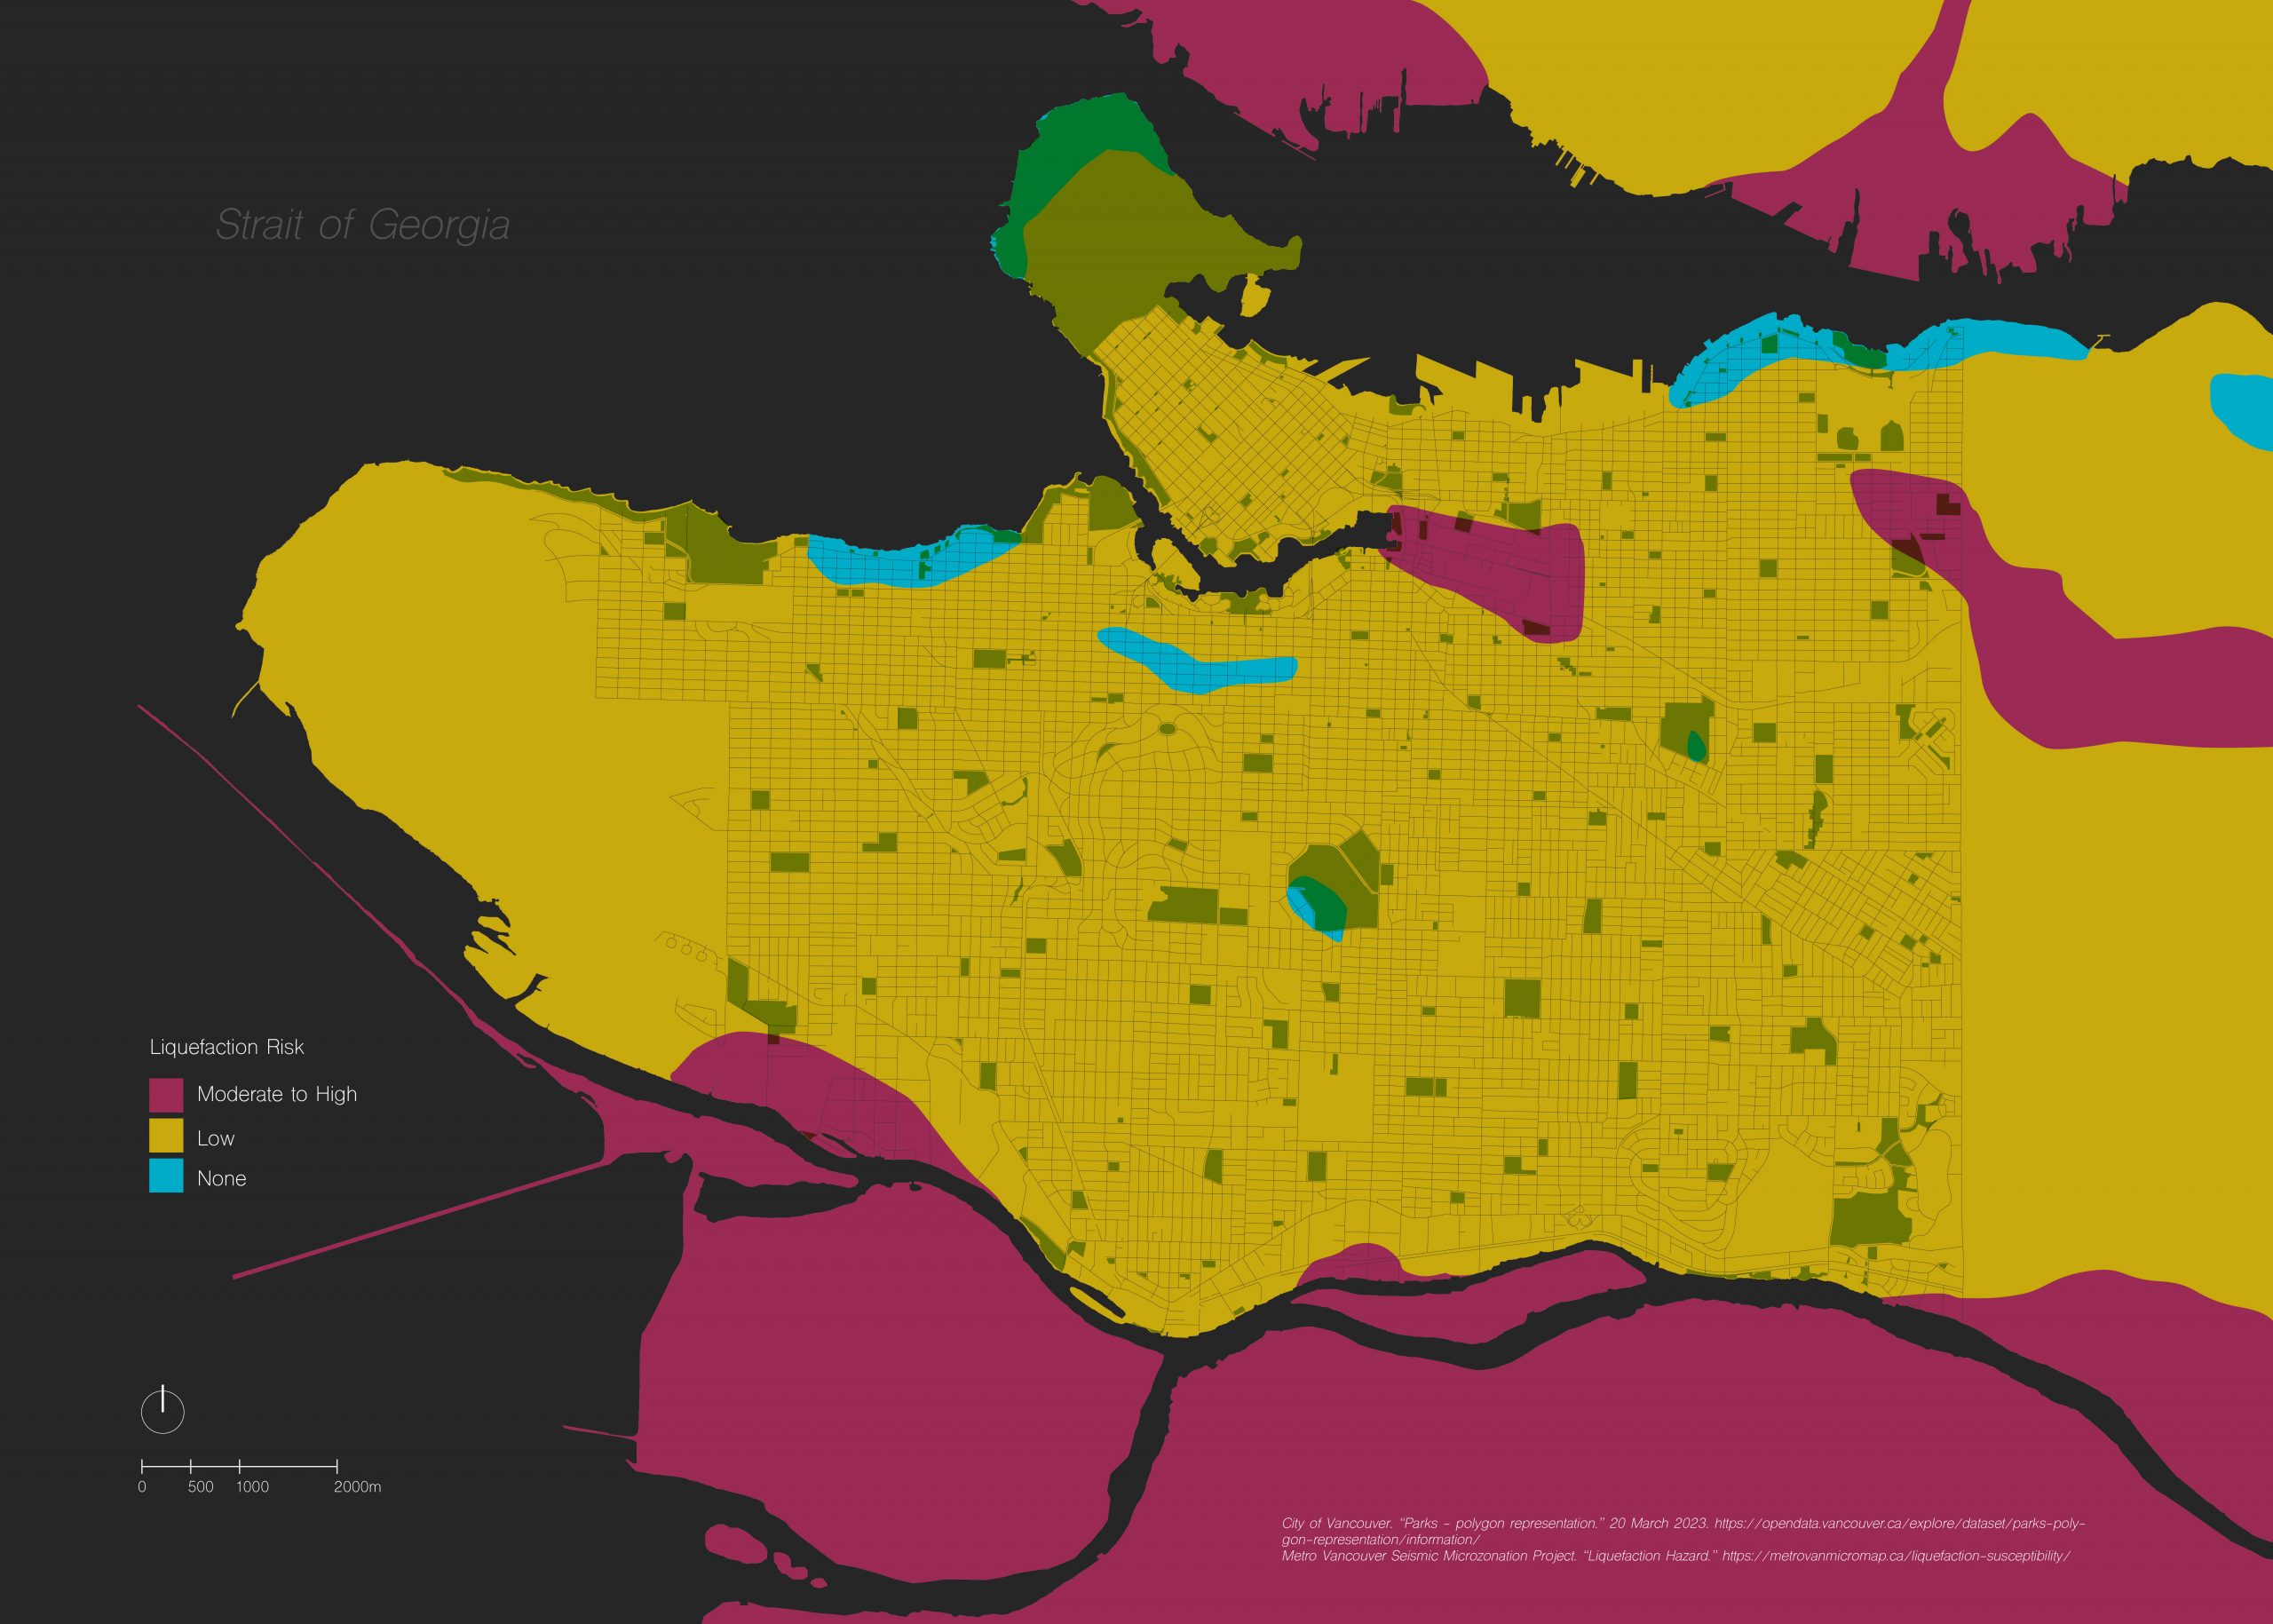
Liquefaction poses a unique challenge to preparing shelter spaces as it has the potential to level the previous infrastructure, essentially creating a space in which previous intentions have been nullified. The liquefaction risk in the City of Vancouver is considered low due to the majority of it constituting of ice age upland sediments; however there are areas such as the False Creek Flats and Musqueam 2 which are posed at a high risk for liquefaction (“Liquefaction Hazard”).
Disaster Response Routes and the Vancouver Region
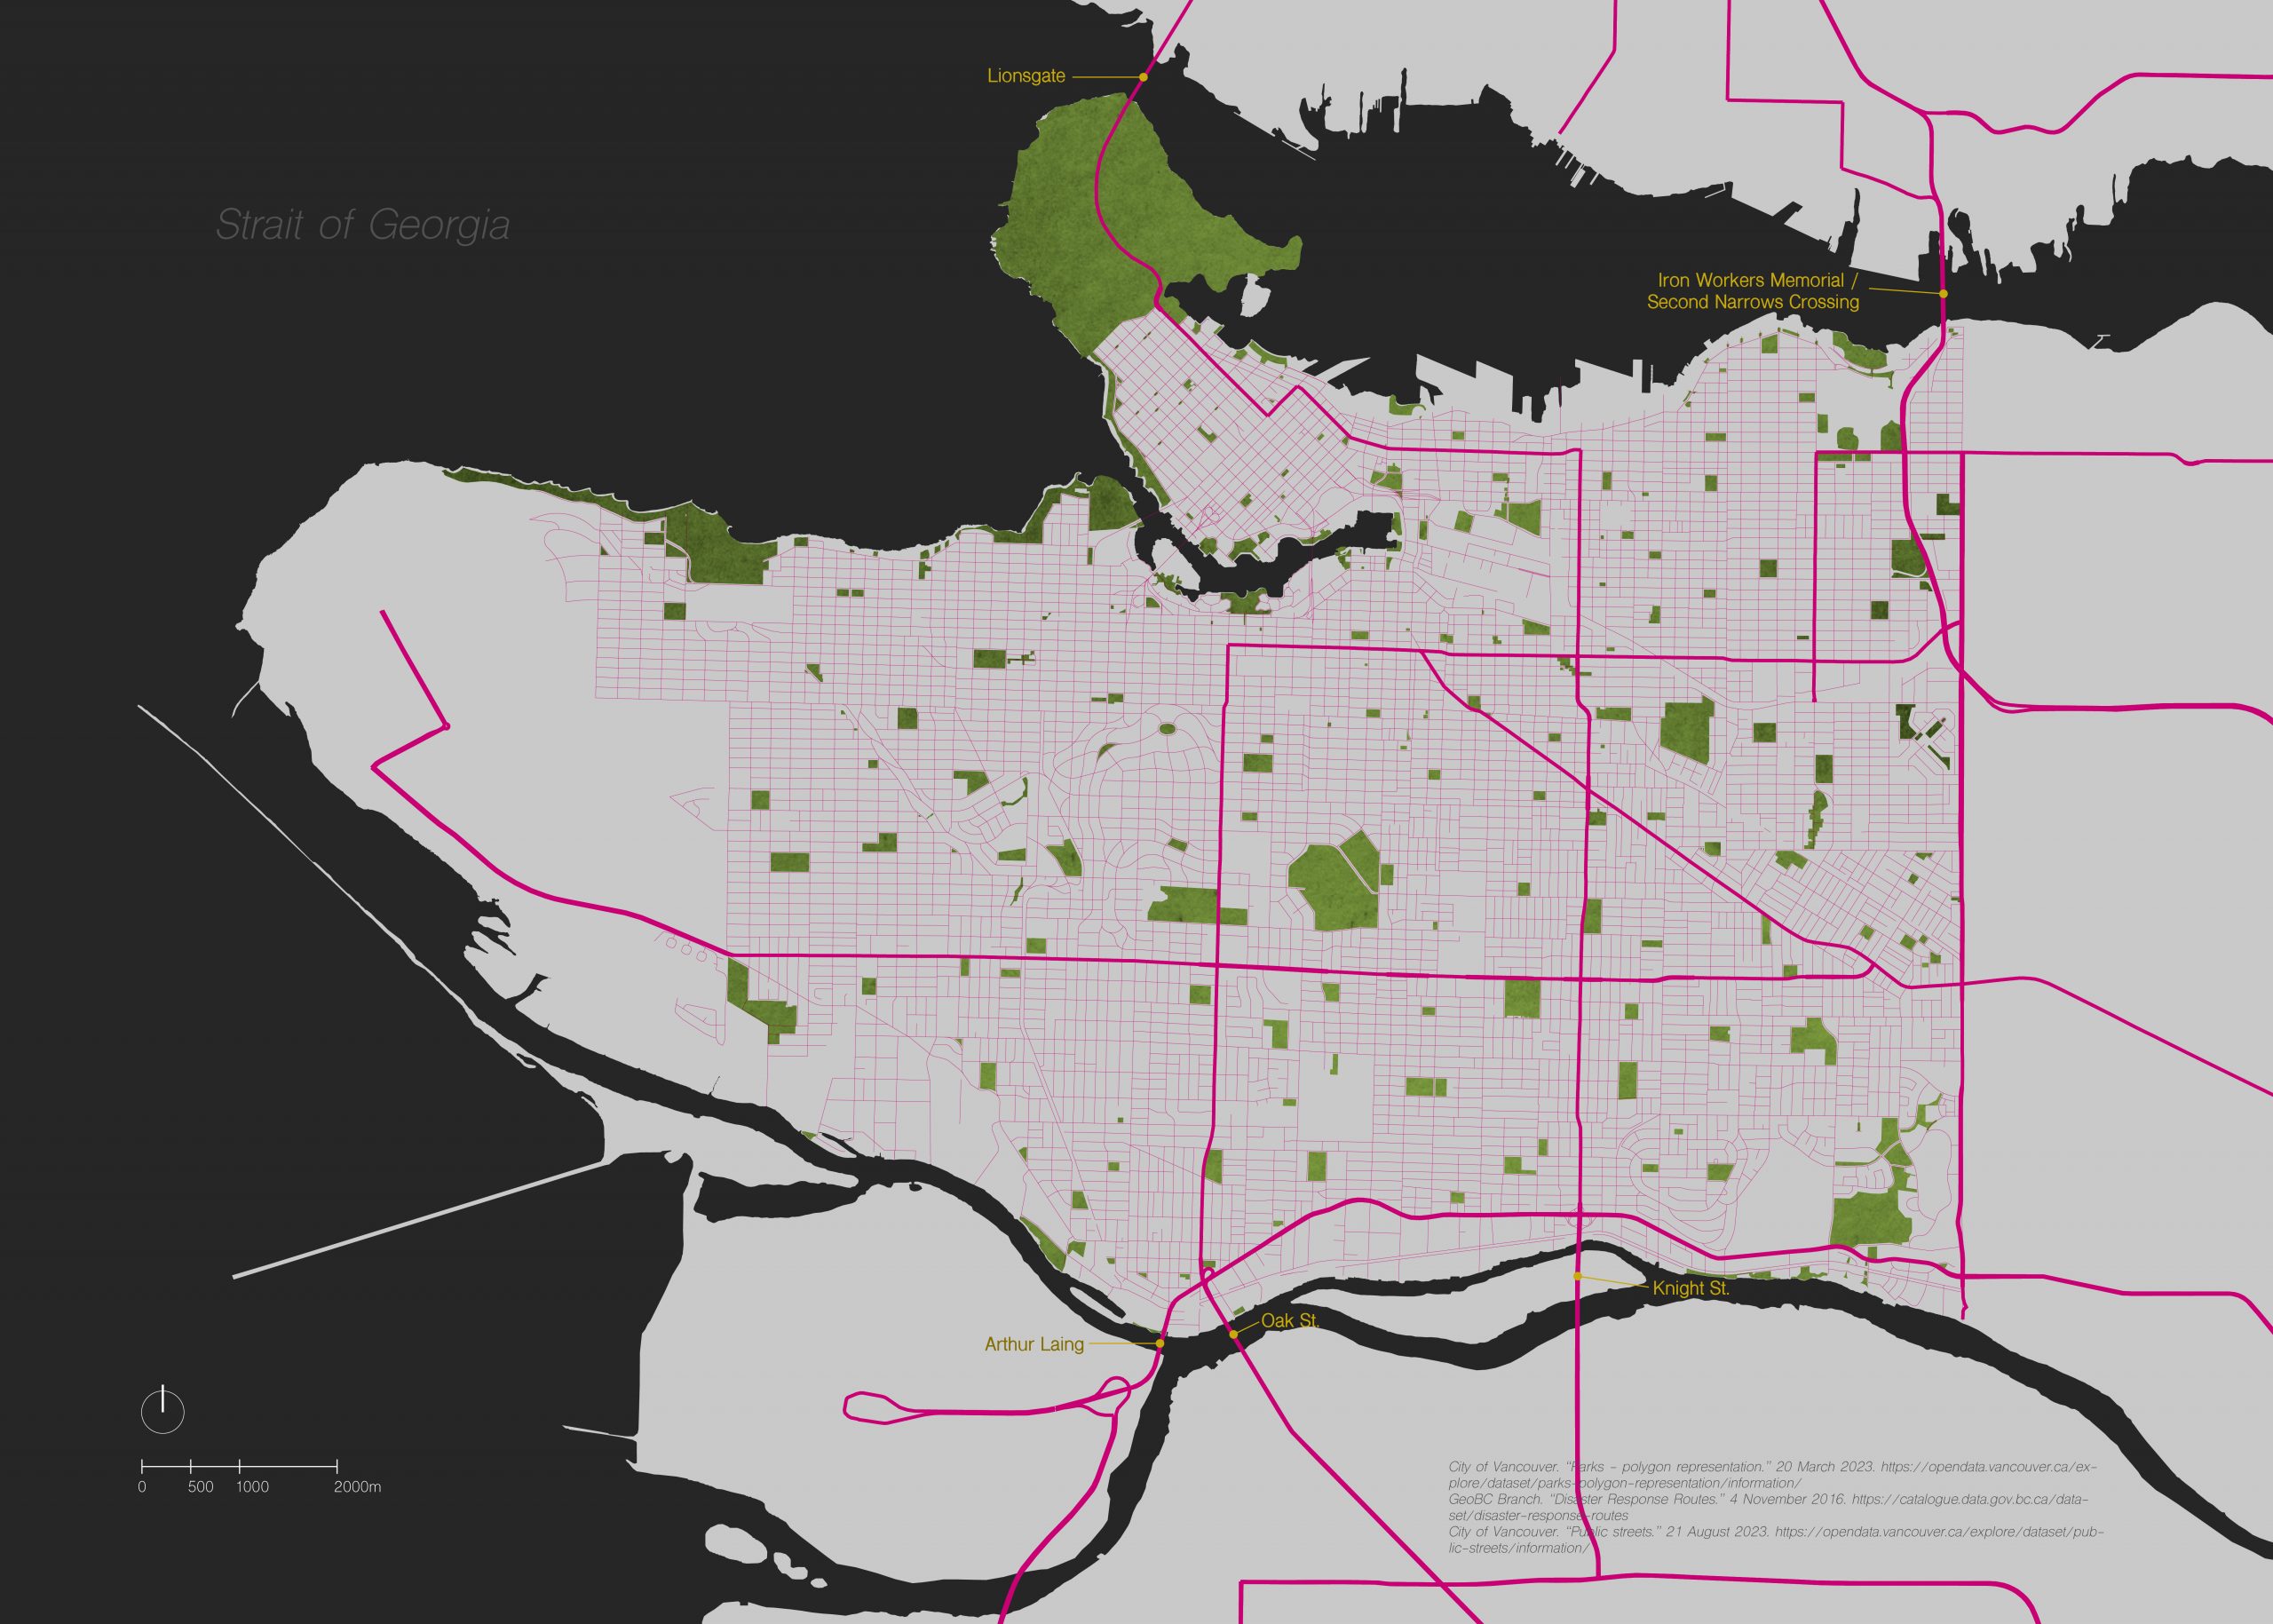
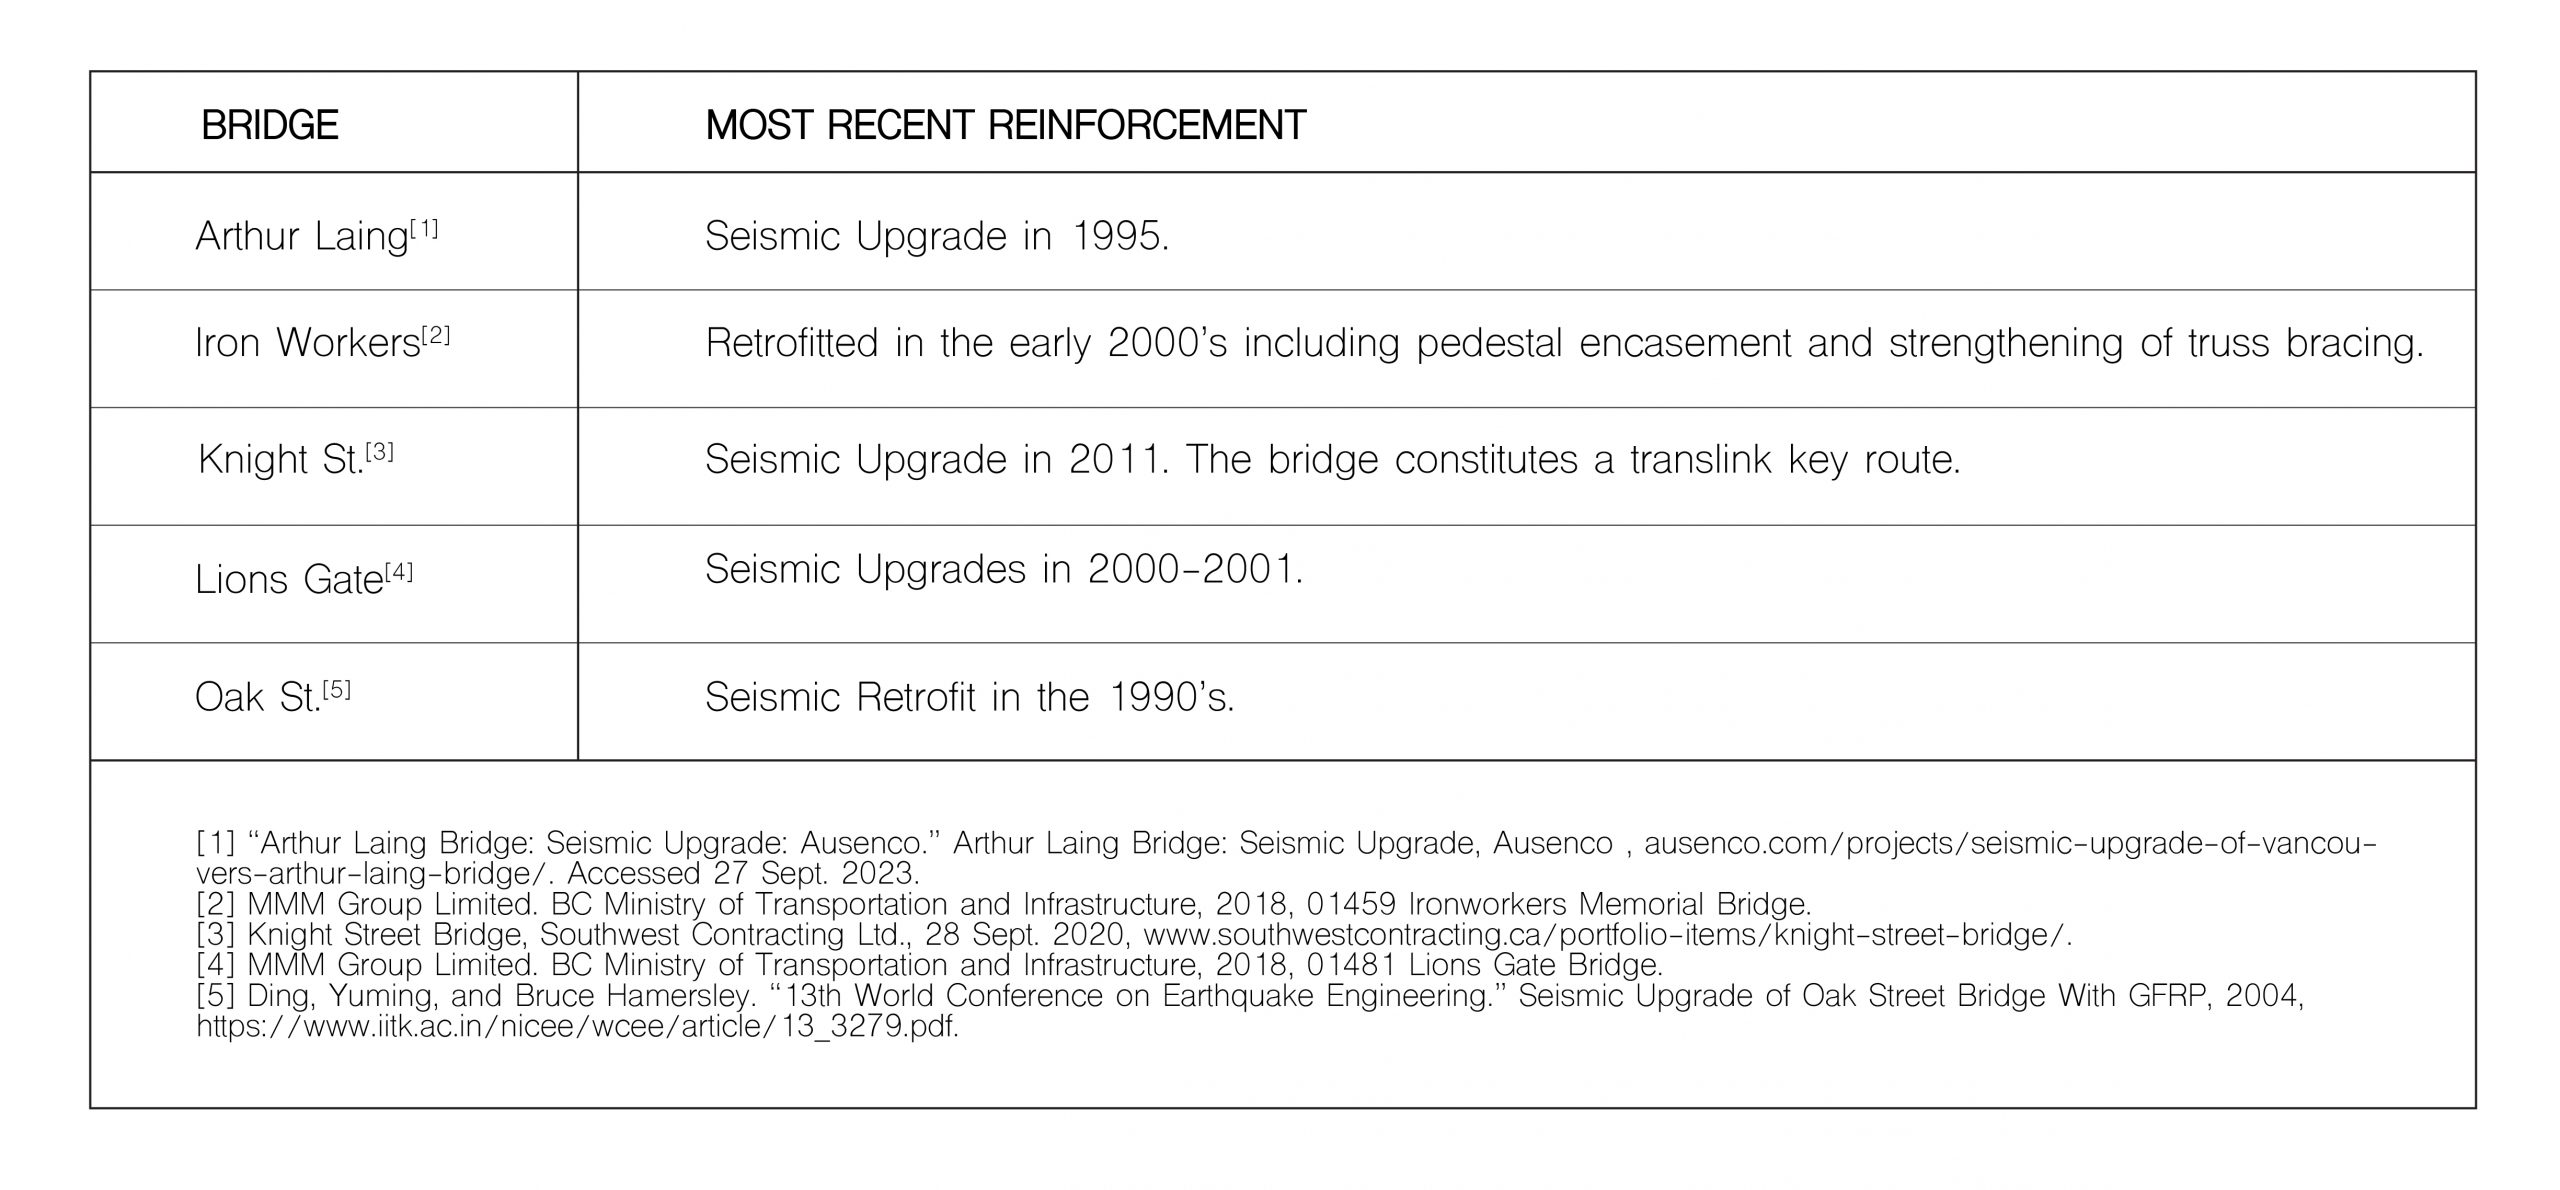
Disaster response routes are essential in distributing essential goods and allowing for emergency vehicle access to areas of the city. These routes are designated for use exclusively by emergency personnel, placing parks in close proximity to these routes in a place of unique advantage in the event of an earthquake. In addition to these considerations it is important to note the state of seismic reinforcement of the bridges along these routes. The bridges that coincide with the disaster routes are designated as lifeline bridges and if they were to fail due to ground motions or liquefaction it would cut off the city from external resources be it food, water, or emergency services.
Socioeconomic Impact on Shelter Availability
Methodology
These maps display the specificities of the relationship between neighborhood parks and their population. Two major parks in the region- Pacific Spirit Park and Stanley Park- were not included in the data as they are highly forested areas that are not considered within the scale of neighborhood parks.
The park data was gathered from Vancouver Open Data, with the polygons used to calculate their total surface area in ArcGIS. These were then measured against neighborhood land area and population figures from the 2016 census. The total land area divided by the total population of a neighborhood gave the data for park surface area available per person. The park surface area ratio was created by dividing the total park surface area in a neighborhood by the total neighborhood surface area.
Park Area Available per Person in each Neighborhood
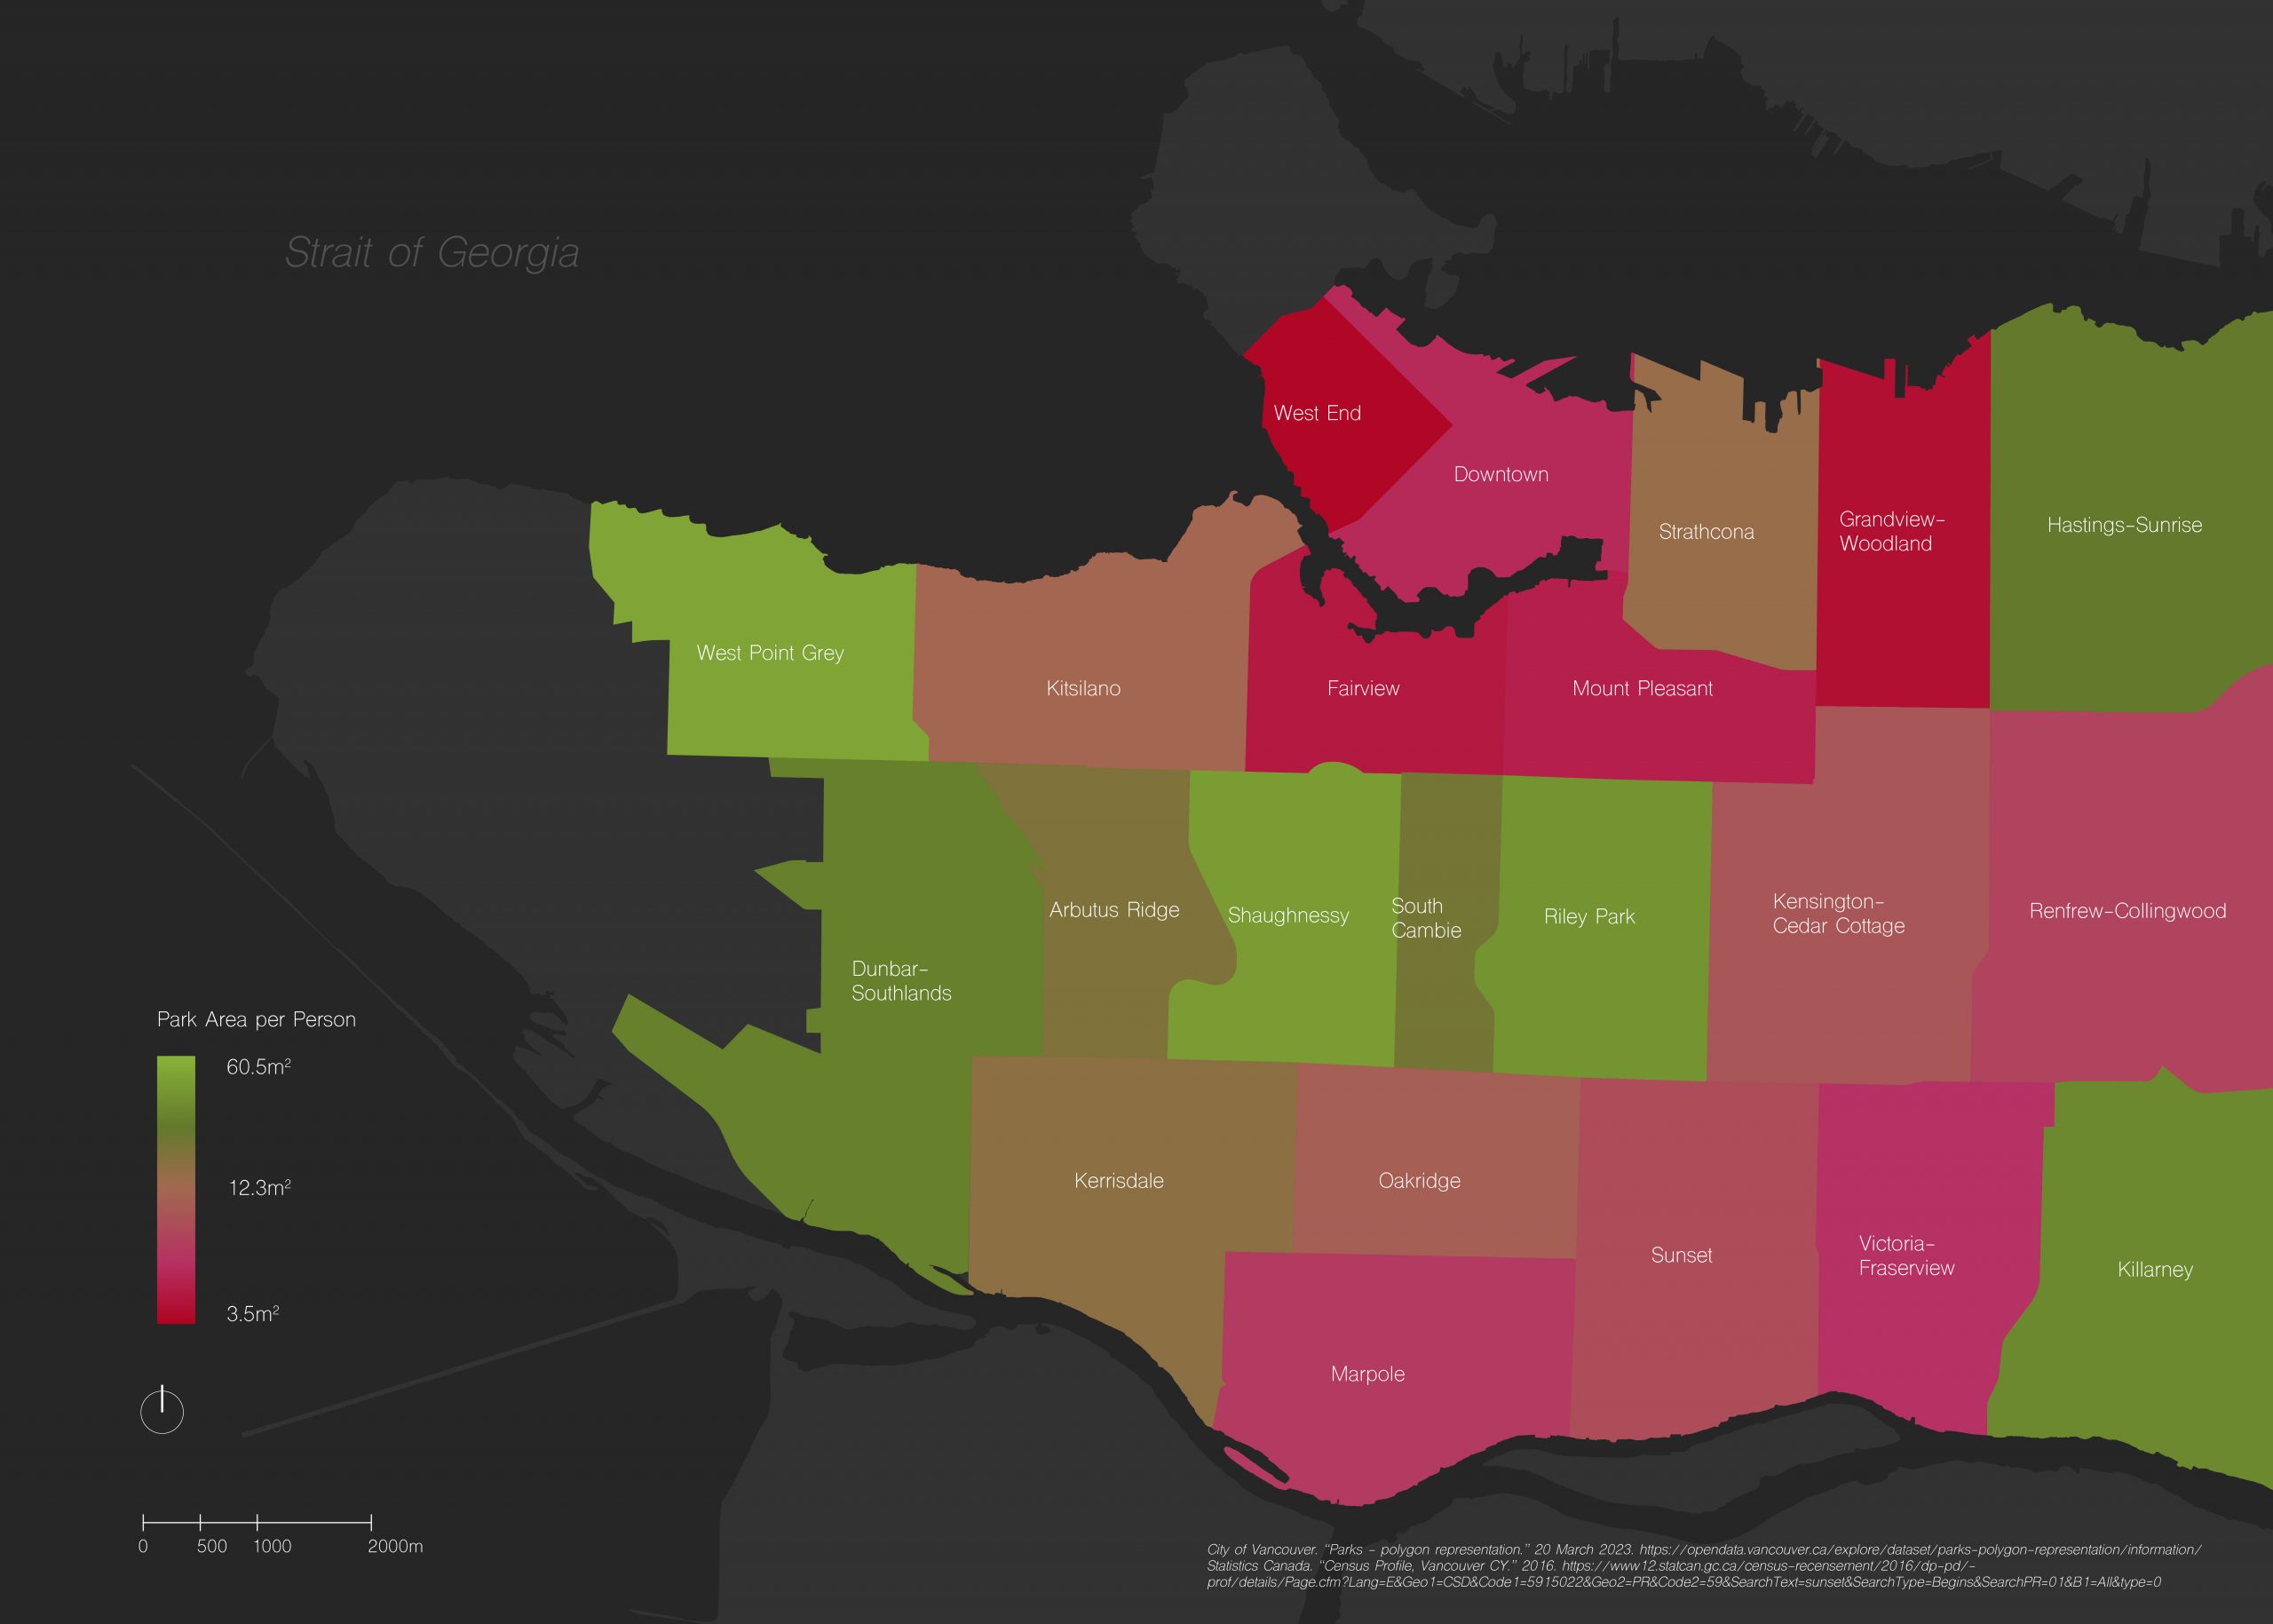
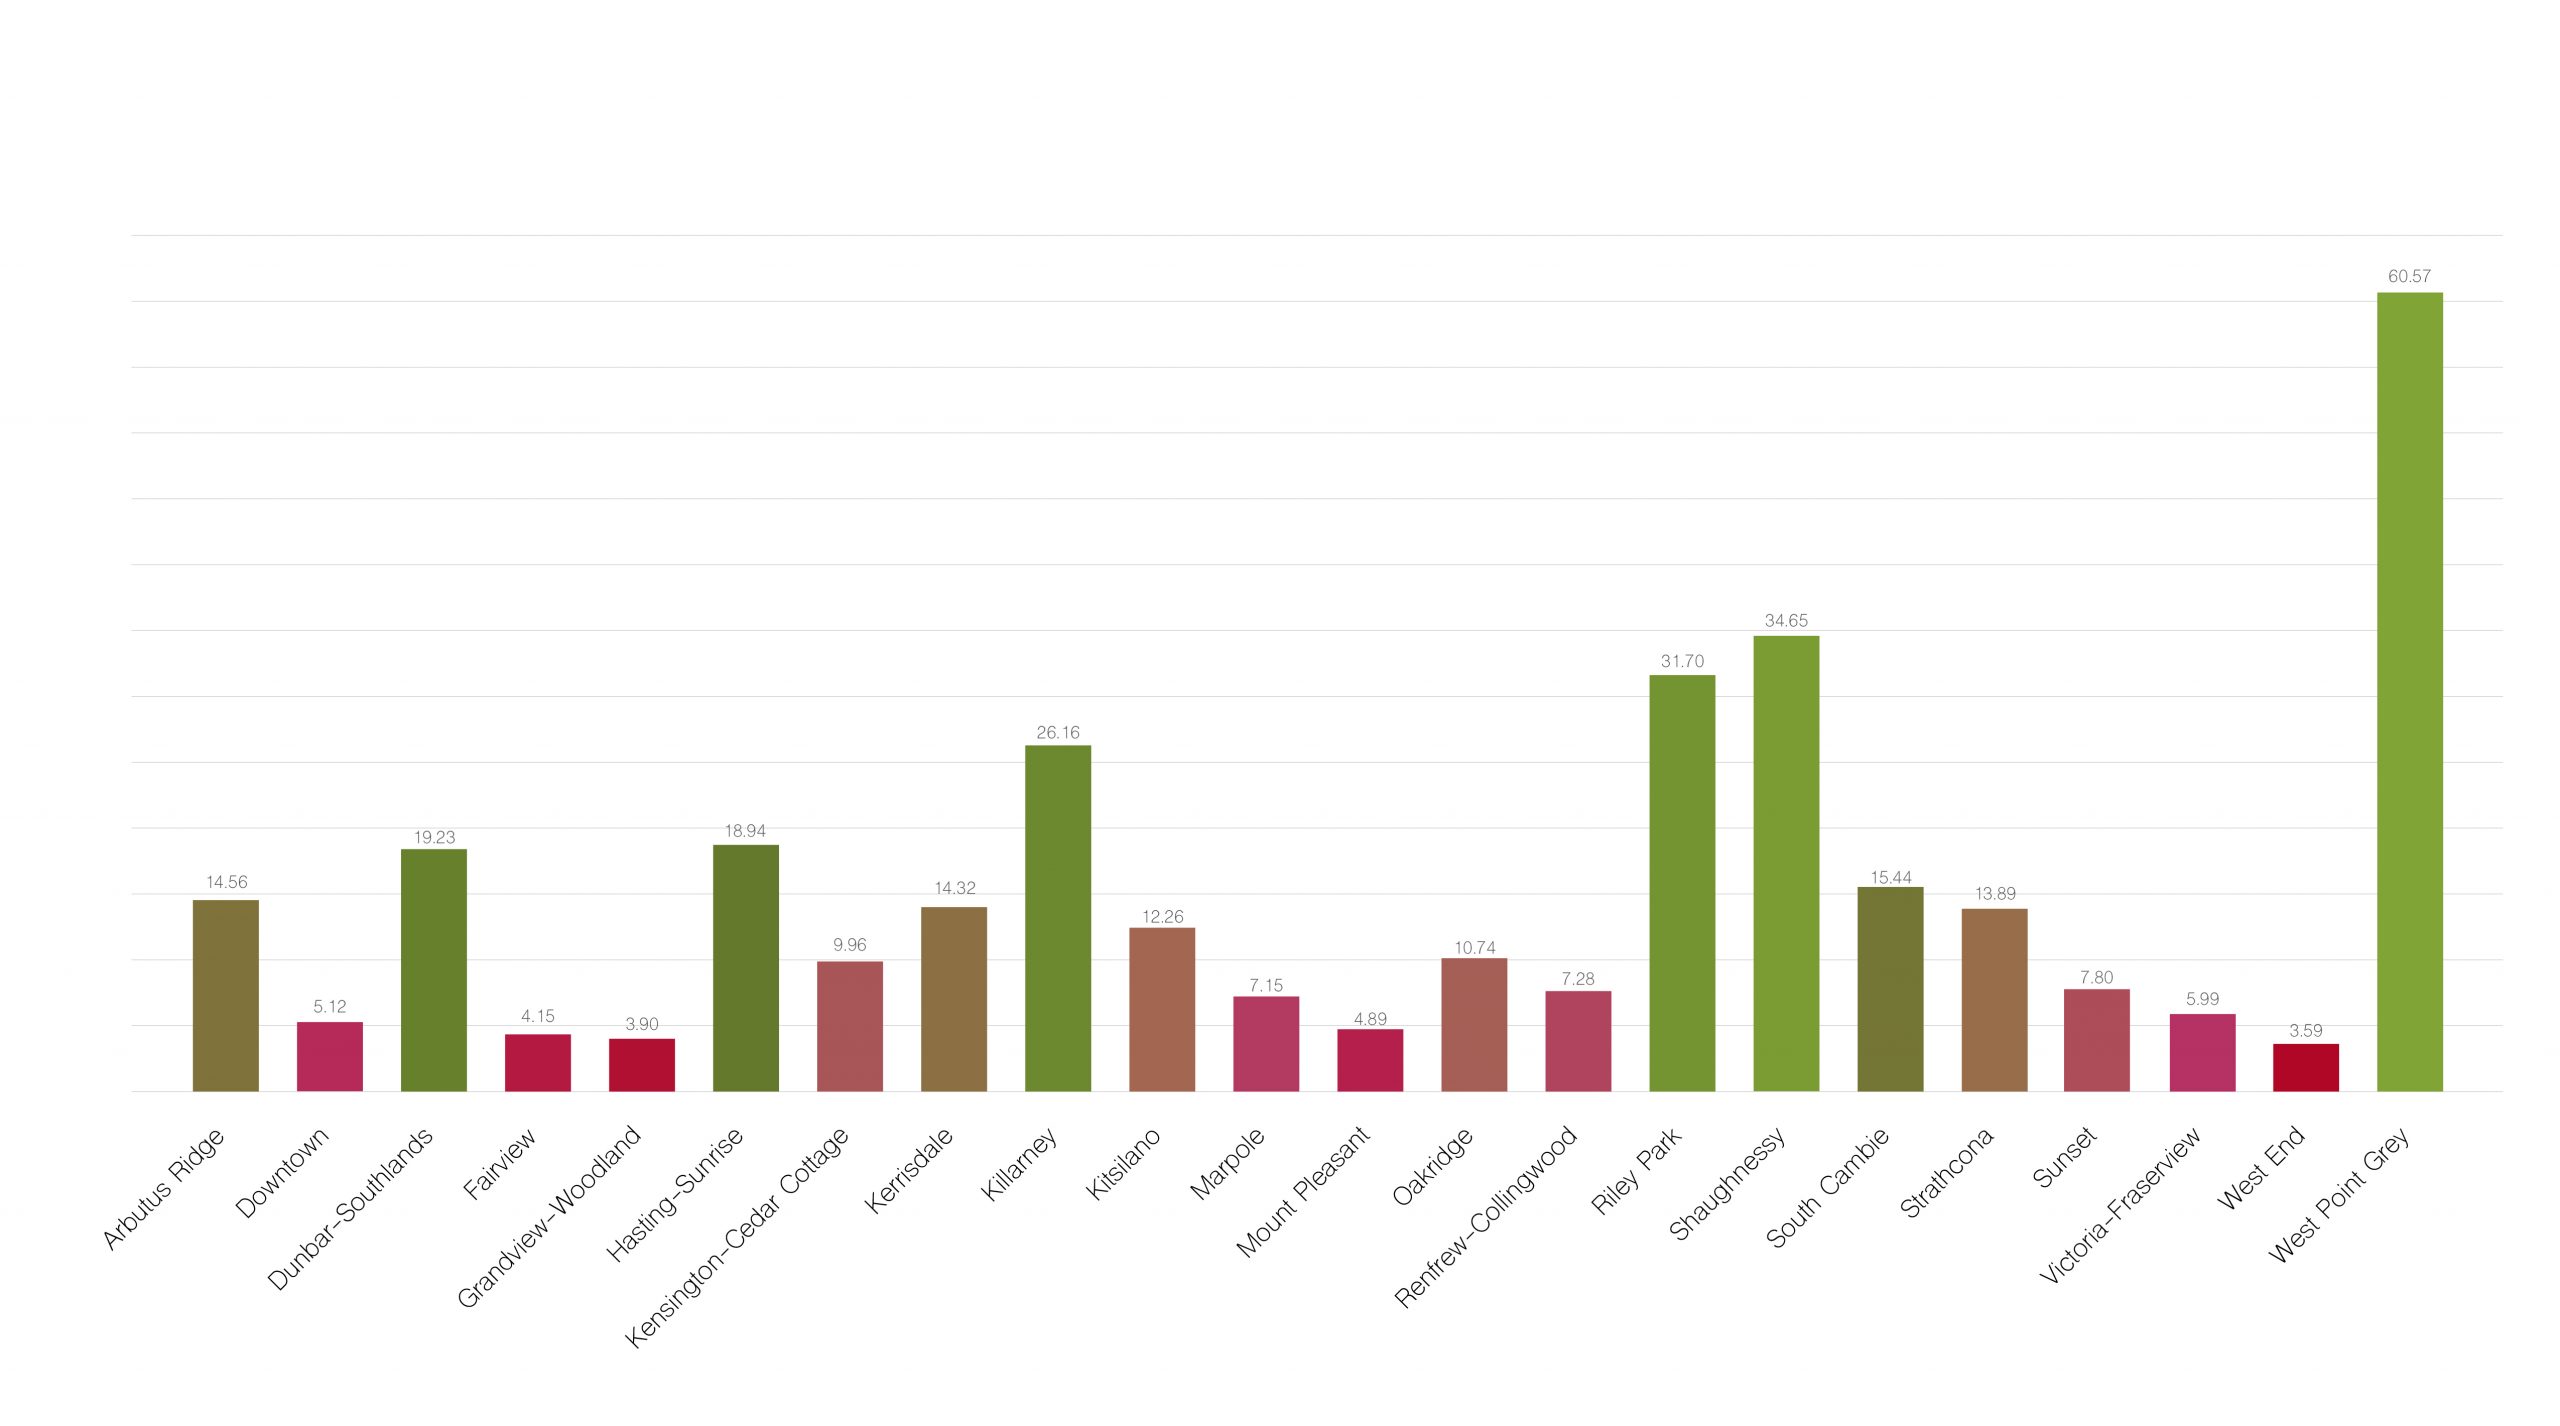
In the event of a disaster, socioeconomic factors become exacerbated. In the first three months after an earthquake, most neighborhoods do not see any progress in their recoveries; however, after the first three months, the speed of recovery is highest in neighborhoods with higher income and lower for renter-occupied homes and homes of recent immigrants (Costa). During this recovery time, access to open green spaces becomes increasingly important and the inequalities in green space distribution will be seen more acutely. A study published by UBC shows that ⅓ of Canada’s cities display a correlation between income and greenness, and of those cities Vancouver’s relationship was more obvious (Quinton et al). The first analysis demonstrates the direct relationship between population and park areas, displaying the available park area per person based on 2016 census data. According to The Sphere Project the minimum area necessary for humanitarian shelter standards is 3.5m2 which Vancouver is equipped for, with the lowest green space per person being in the West End at 3.5m2 (French, Emily L.). However, when contrasting that to the 60.5m2 available per person in West Point Grey, the inequality of post-disaster conditions can be seen.
Percentage of Neighborhood Allocated to Park Space
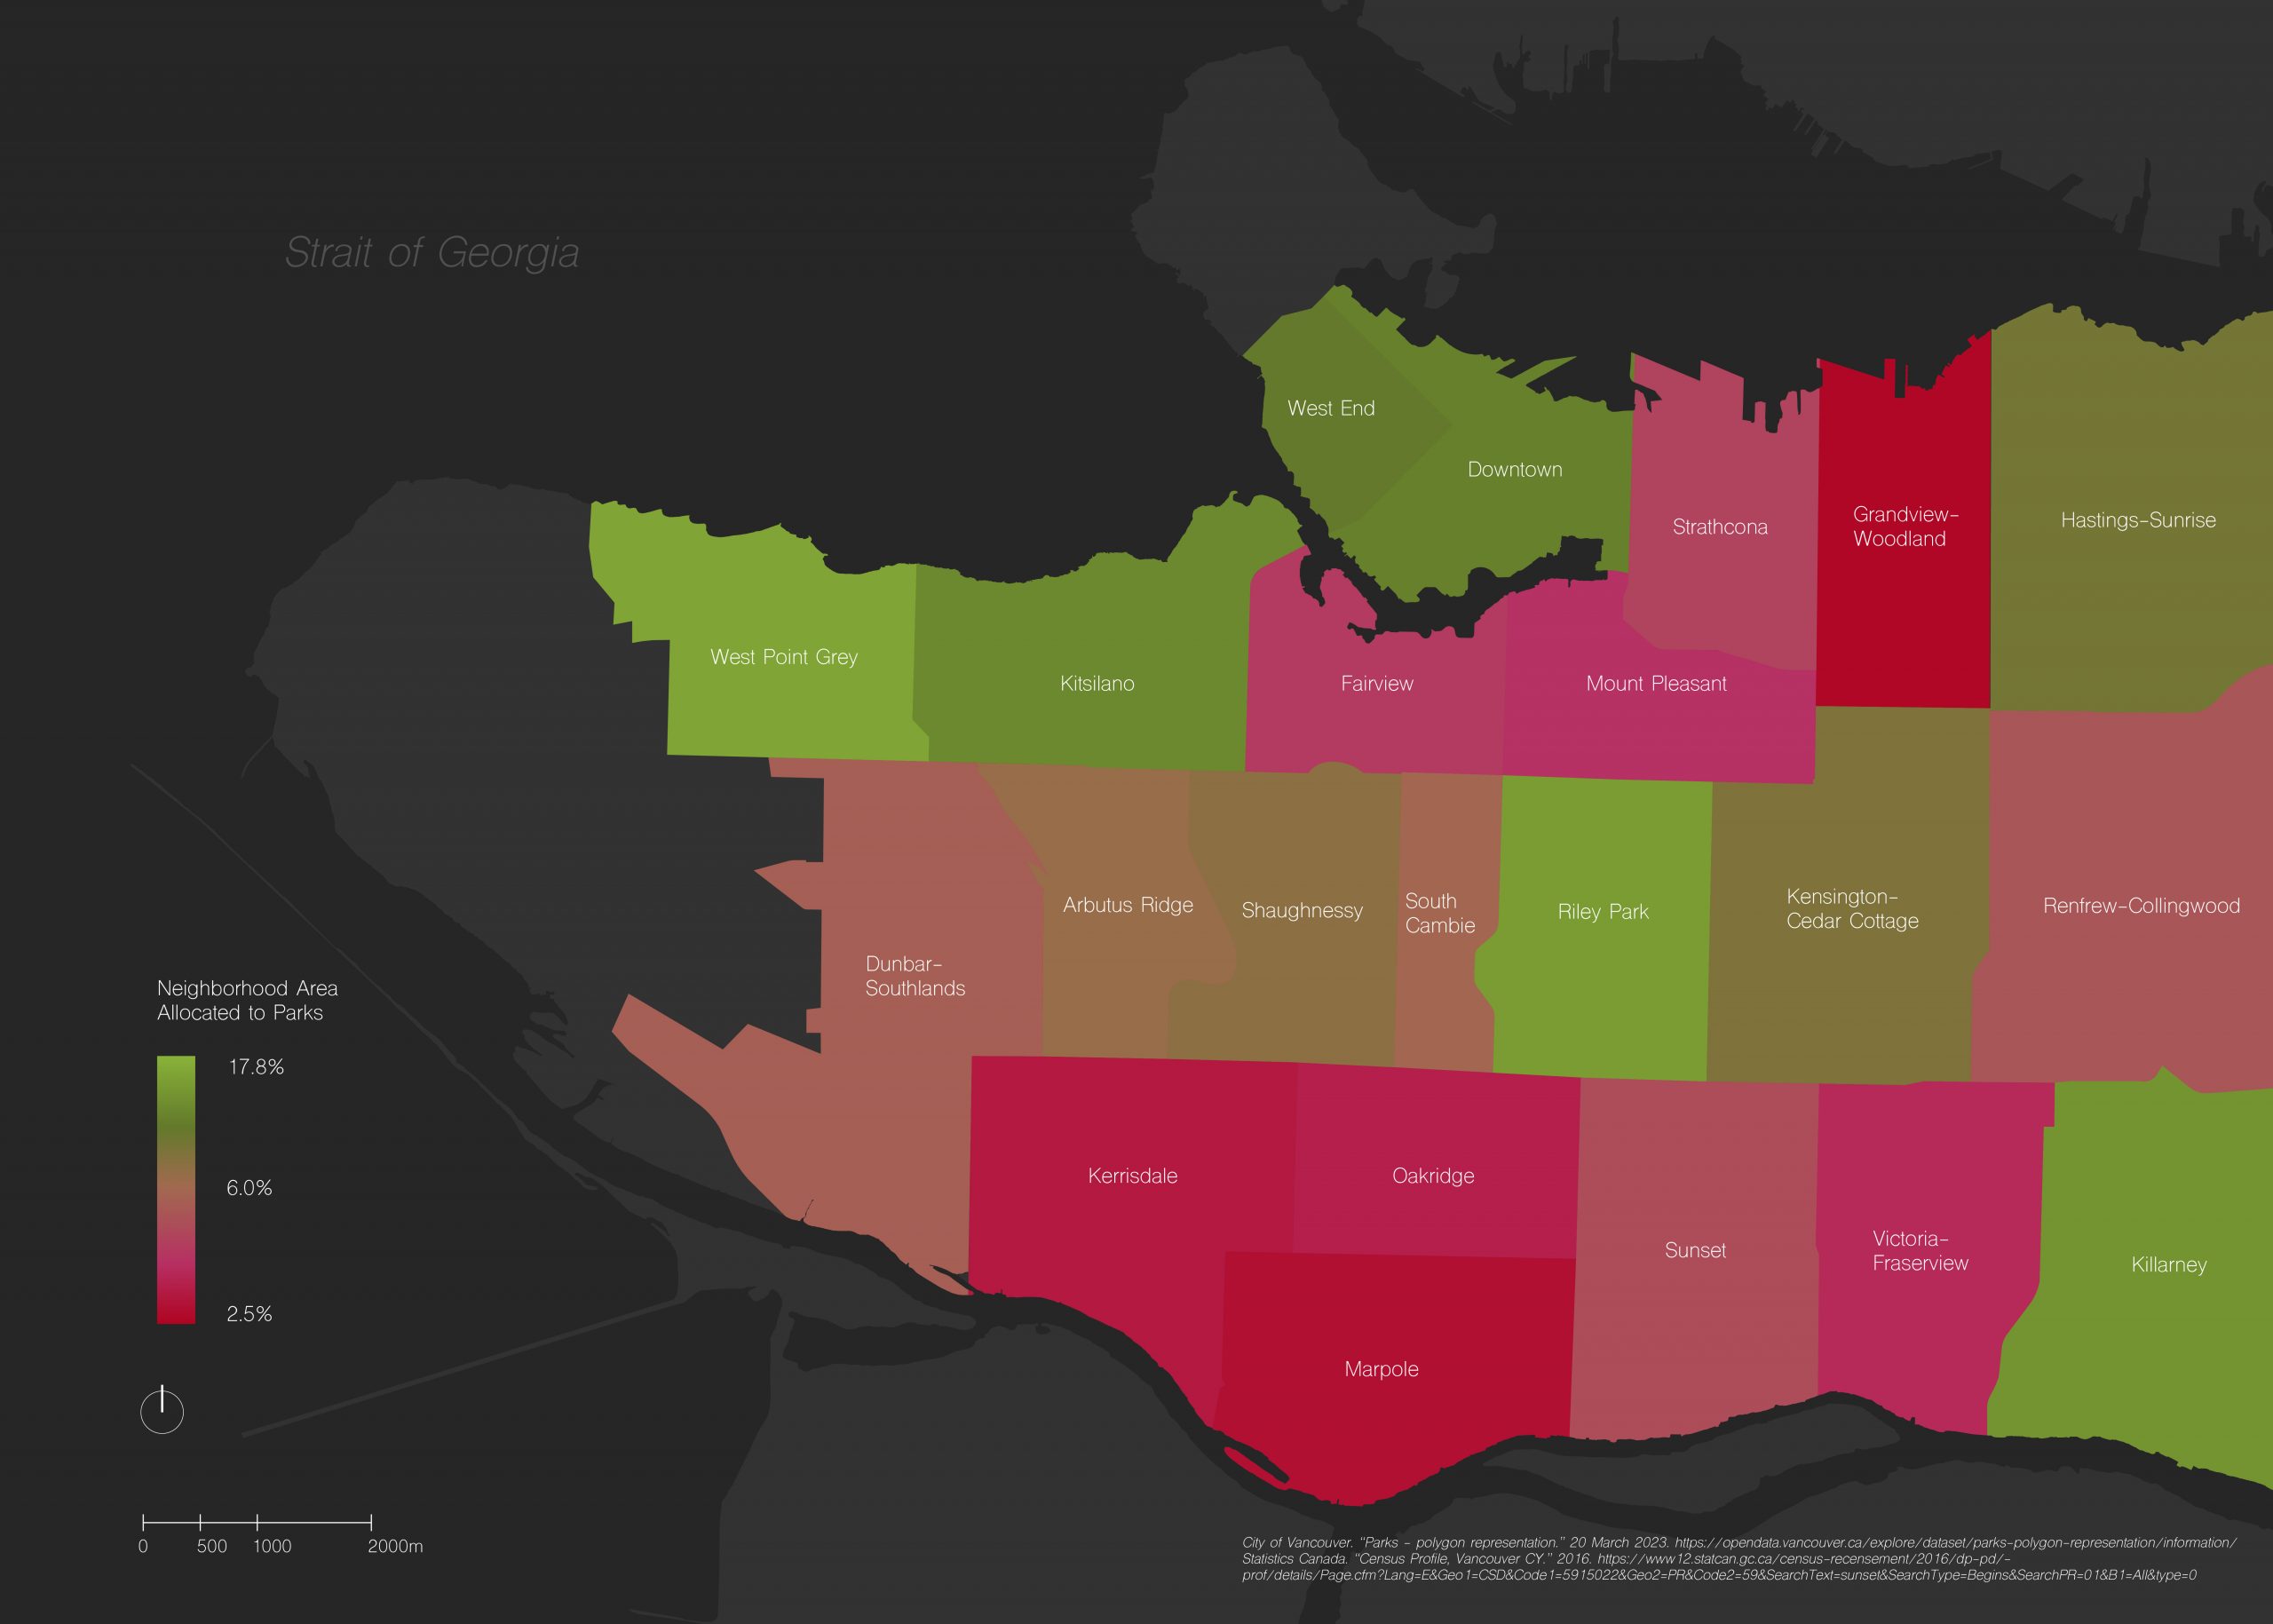
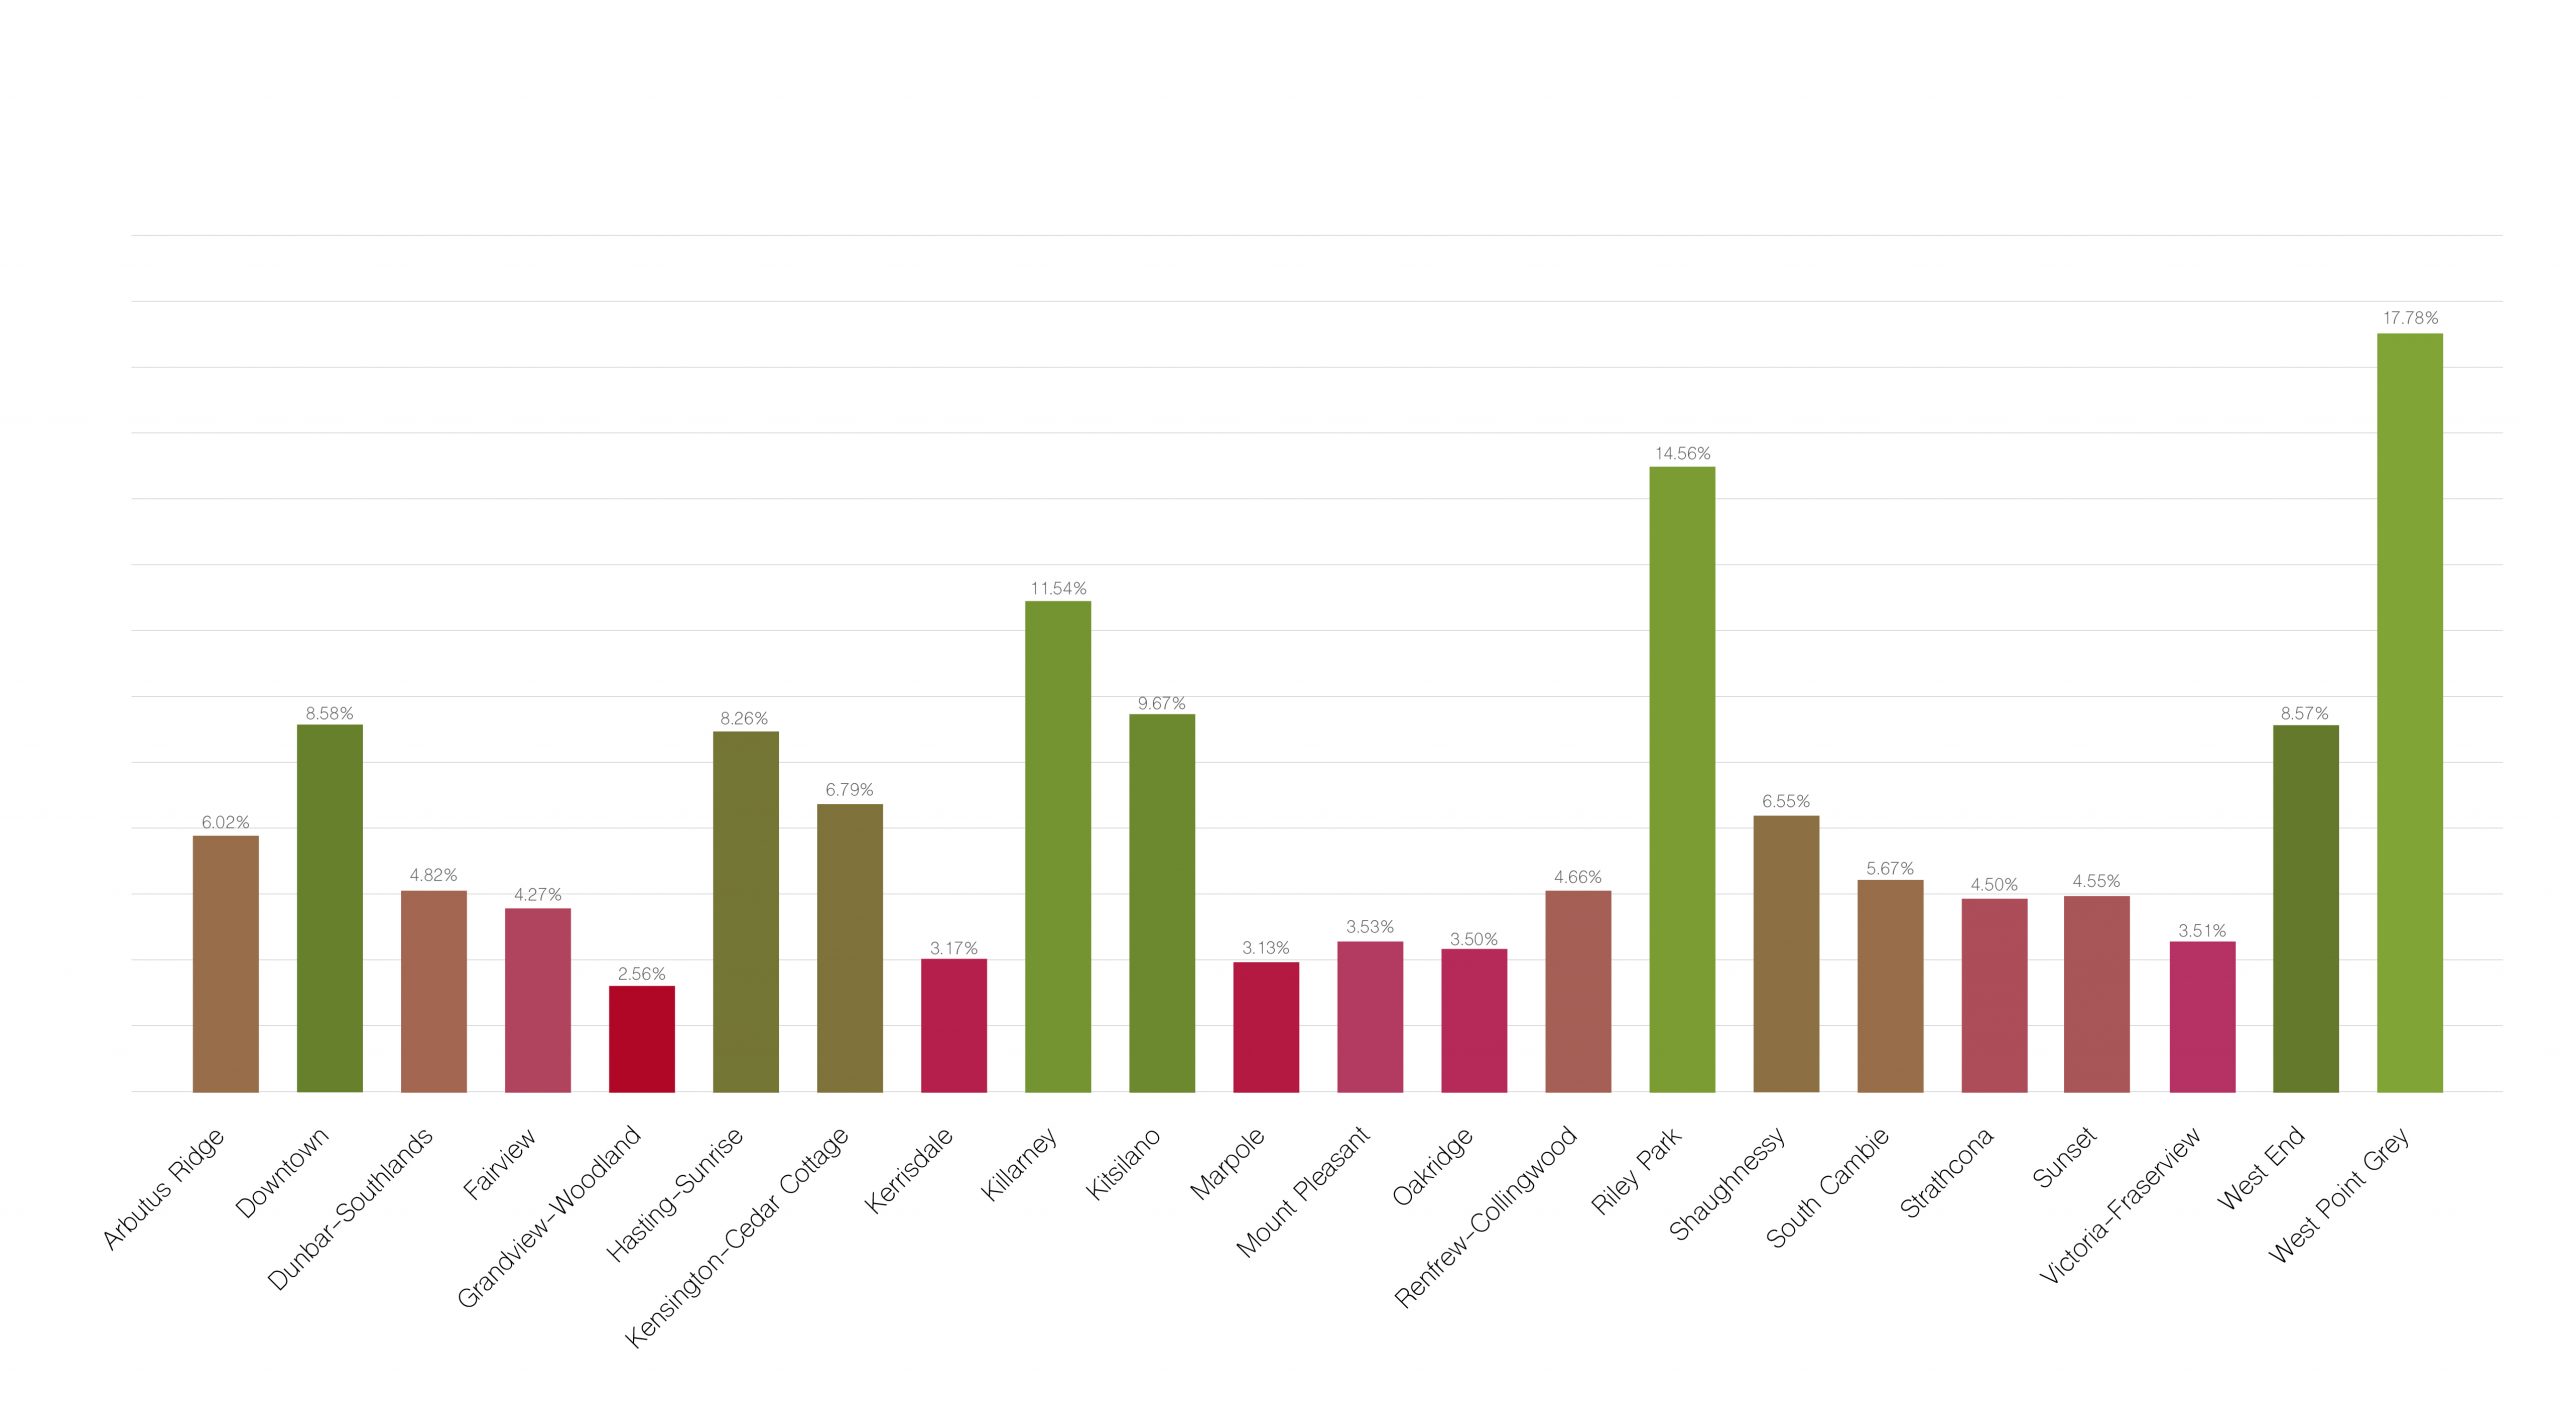
The second analysis shows the percentage of a neighborhood’s area that has been allocated to parks with the lowest being in Grandview-Woodland at 2.5% allocated to parks, and the highest once again in West Point Grey at 17.5%. This analysis more directly displays the prioritization of greenspace in the city from an urban planning standpoint.