The goal of our final project was to find the total area of the Greater Vancouver agricultural land reserve that is suitable for agricultural use based on the most current data available. The data we used was soil types and capabilities, land cover, rivers and lakes, roads, and parks and golf courses. map1 shows the total agricultural land reserve within Greater Vancouver which equals 21% of the census metropolitan area.
We decided that it was best to break up the group work into chronological sections based on the project outline questions given to us for the report. We communicated by Facebook chat and Google Docs to make sure everyone was on track. Looking back, it might have been better to have everyone do all the lab work together instead of sequentially so everyone was familiar with everyone’s steps in creating the maps and the analysis that they did.
My most valuable contribution to the group was the maps I made since they were the base maps for the rest of the maps and analysis that had to be done in the ALR area. I also spent hours in the lab recovering work after it was not saved properly to ensure that the rest of the group could finish their analysis and did not have to start over. All my group members did interesting research for the final report section of the project.
Again, I think the only way to do a project together is for all group members to show up together in the lab and work on the maps together. Google Docs is a great resource to share open information for team members. However, it is not the same as everyone participating in all steps of map making and analysis in terms of quality and outcome of material learned by all group members.
I think it is interesting that so many roads run through the agricultural land reserve. I think in order to ensure full productivity of the land reserve there would be limitations on development within the area. However there is still almost 70% of the designated area that is useable for agriculture, which is 14% of the Greater Vancouver census metropolitan area. For a highly developed area with such a large population it is impressive that 14% of the area can still be used for agriculture.
The most useful and interesting GI analysis technique I learned in this project was how to create a query to select multiples values within one field in an attribute table. This query is:
NAME OF FIELD IN (unique value, unique value, unique value)
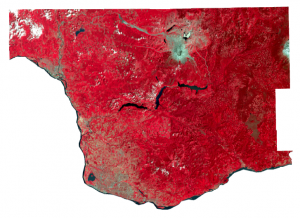
This query is important when there are many different classifications of data that can be grouped into one. For example when creating a map of land cover there were 3 different types of forest that can all be grouped into one. map2 shows different types of land classification. map7 shows all features taken out of the agricultural land reserve to determine the total area of unusable land. map 8 visualizes unusable vs usable land for agriculture.


