Monthly Archives: October 2015

Reflection: Labs 1-3

Reflection

In completing these labs it is important to reflect on the knowledge and transferable skills acquired in doing so. Each lab has taught me a new skill and given me the opportunity to familiarize myself further with the ArcMap program. Using this program to solve mapping problems that I had never before envisioned myself doing is a valuable experience that can someday transfer into practical skills that will be desirable in the workforce.

Lab 1

Before completing the first lab I had absolutely no knowledge of GIS Software. Therefore the whole lab was important for me. Getting time to begin navigating the interface of ArcMap was useful because like any program, you must use it routinely to be familiar with it. Learning about the different types of data and how they are used and displayed in Arc systems was a comprehensive part of the online training.

Lab 2

The second lab was important to practice using different types of data, learning how to change data files when necessary, and knowing when it is necessary to do so. One of the most important things from this lab was learning how to change projection systems using the ArcToolbox application. This is important because data is not always represented in the same projection but in order for a map to be useful, all data should be in the same projection. Learning about specific uses of Landsat data was another valuable part of this lab. It is interesting to think about how many practical uses there are in looking at the world from these satellite images.

Lab 3

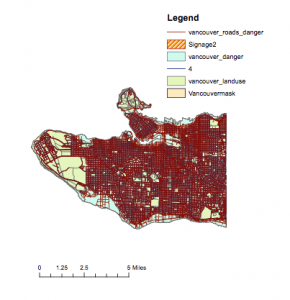
This lab was much more difficult than the first two as it went into more specific skills and data analysis within the ArcMap program. The thing I found the most interesting was being able to determine which specific healthcare and educational institutions would be in danger if a tsunami of a certain size hit Vancouver by manipulating layers of data and then looking at the new overlays’ attribute tables to tell me the names of the institutions that would be affected. The result of this lab was a map of Vancouver showing the area within 1km of the shoreline and under 10m elevation that would be in danger if the tsunami hit (if Vancouver island weren’t in the way). It also shows the specific roads that would be in danger (unfortunately my map shows all of the roads, not just the main ones making it a bit difficult to see). This type of geoanalysis is important for cities that are at risk of tsunamis when planning a city or planning for evacuation routes if a tsunami is predicted.

Lab 3: GEOB 270

Danger Zone in Vancouver

12 percent of the city of Vancouver would be in danger if the tsunami hits. To calculate this, first I found the area of each layer: Vancouvermask_danger and Vancouvermask. To do so I found the area of the layers by creating an AREASQKM field in the attribute table, then calculating the geometry of the area in square kilometers.

Vancouvermask_danger: 15.8 sqkm

Vancouvermask: 131.0 sqkm

15.8/131= 0.120

= 12% of Vancouver in the danger zone!

Facilities Within the Zone

False Creek Residence, Villa Cathay Care Home, Broadway Pentecostal Lodge, and Yaletown House Society are the healthcare institutions that are in danger if the tsunami hits.

The educational institutions in danger are Emily Carr Institute of Art and Design, Henry Hudson Elementary, False Creek Elementary, St. Anthony of Padua, and Ecole Rose Des Vents.

To find these I used the select by attributes tool and selected healthcare and education where it intersects with Vancouver_dangerzone. I found the specific institutions by looking in the highlighted area of the healthcare attribute table, then the education attribute table.

Screen Shot 2015-10-23 at 11.43.43 AM

Vancouver Danger Zone with Signage

Lab 2: GEOB 270

Projection Problems

In this lab I practiced fixing misaligned and improperly referenced spatial data. Area, angles, direction, and distance are affected when data is projected into a different coordinate system and this can sometimes cause issues in how it is displayed when added to a map. Sometimes you need to change the layer’s coordinate system. To do this you launch ArcToolbox and use the data management tool to change the layer’s projection.

Landsat Data

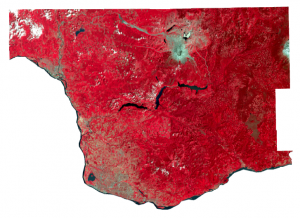
Landsat is a remote sensing program that has been continuously scanning the earth since 1972, using sunlight as its energy source to measure the response of objects and surfaces on earth. Satellites use wavelengths to produce images of these objects and surfaces.

It isĀ used to measure land change estimates due to natural disasters, for example the effects of a hurricane on land-water conditions before and after a storm. The question of geographical analysis in an example like this would be: What effects did the natural disaster have on the land and on the water in a specific area? The location you would choose would be the specific location that the disaster happened in (everywhere in which water and land was effected by the hurricane). The interval you would select would be a period of a week or so from the day before the hurricane to the week after. You could also look at other data from previous years to see the normal variations that occur because of seasonal factors in the land and water in this area. Season can also affect land and water patters so this is something you would want to take into account when looking at the data.

Screen Shot 2015-10-23 at 10.51.27 AM

Example of Landsat Data