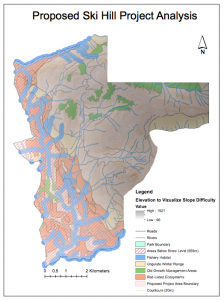
After conducting a geo-analysis on the area, it is quite clear to me that the costs of going through with this project would outweigh the benefits. The proposed project is for a ski resort to be built in Squamish in the pristine Garibaldi area. As a primary analyst for this project, I would say when taking into account the quantity of protected areas within the proposed project boundary, building a ski resort here would not be worth it. If you are concerned about protection of old growth forests, ungulate winter habitat, and red-listed ecosystems and marine life in the area, you must review my data before proceeding with the development. Not to mention, the portion of the proposed project area that is below 555m, the snow level in this area.
To conduct this analysis I retrieved data from BC government websites about ungulate habitat patterns, red-listed ecosystems, old growth forest management, and riparian ecosystems. I also got data to show existing roads, rivers, contours, park boundaries, and elevation to produce a full analysis of the area in terms of elevation and accessibility. By clipping all these data layers within the project boundary I was able to clearly visualize how much of the area would be affected by this project. By manipulating the data further, I was able to show specifics of which types of red-listed ecosystems and rivers would be affected. I was also able to create a layer showing how much of the proposed area is under the regular snow line.
My analysis found that 44.6 % of the total project area falls within protected areas and 29.9 % of the area is under 555m of elevation, which means snow rarely sticks below that level. 6.8 % of the project area has old growth forest areas. 7.9 % of the project area has mule deer and mountain goat winter habitat. 24.8 % of the project area is red listed species habitat. Finally, 1.5 % of the project area affects streams and riparian areas. All of these areas are areas, which should be protected to preserve biodiversity and old growth forests in this area. If it were not almost half of the project area that is habitat of these at risk species, it may be more excusable.
The environmental impacts that this project will have highly outweigh the benefits for many reasons. The ecosystems housed by the area take up almost half of the project; therefore it would be truly devastating to this ecosystem to disturb these habitats. Secondly, there are four other ski resorts within an hour and a half of the proposed area. With almost 30 % of the project area under the snow level and with such great competition in the area, it may not be economically beneficial to build a resort here. Perhaps it would be more productive to look at an area that is already more trafficked by backcountry skiers. Maybe a more trafficked area will have less biodiversity within it.


