Data
Part I: Data Acquisition
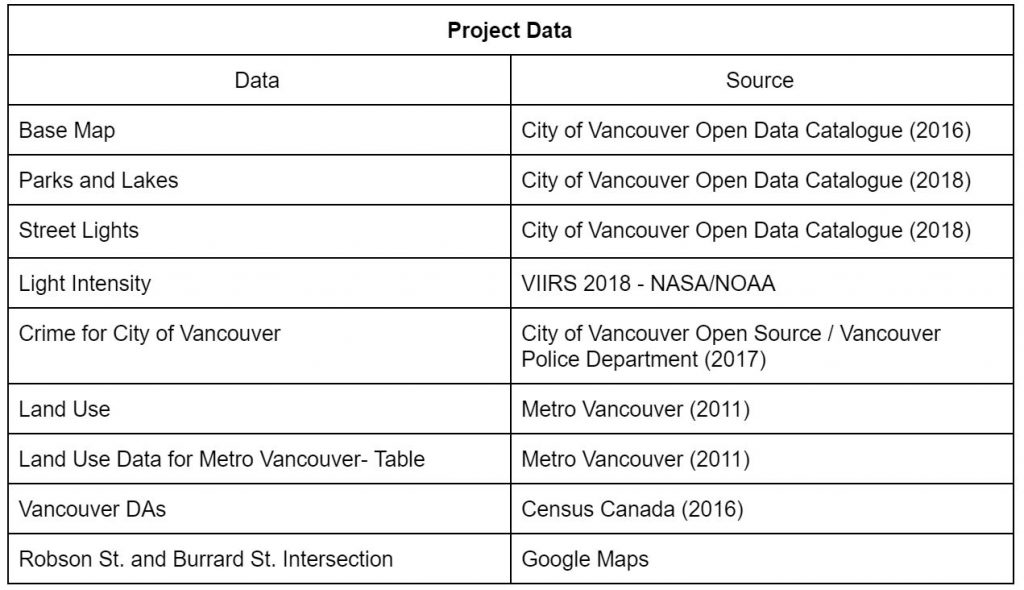
Table 1. Data used for the MCE and Least Cost Path analysis and the respective sources that the data was taken from.
- All the data was re-projected into the NAD83 UTM Zone 10N using geoprocessing tools.
Part II: Data Clean Up for MCE
- Creating Raster Layers for MCE Factors: The data required for the MCE: “Light Intensity”, “Crime” and “Street Lights”. The crime point and street lighting point data were used to create a point density layer using the “Point Density” tool; converting both the crime point and street lighting data into raster data. Crime density was then normalized using the “Square Root” tool to transform the range. Satellite data for light intensity was extracted from the VIIRS satellite and clipped to the City of Vancouver. Land use was simplified into 10 land use classes, zonal statistics were used to rank land use classes based on average number of crimes that occurred in each class, to following table shows the result of this analysis:
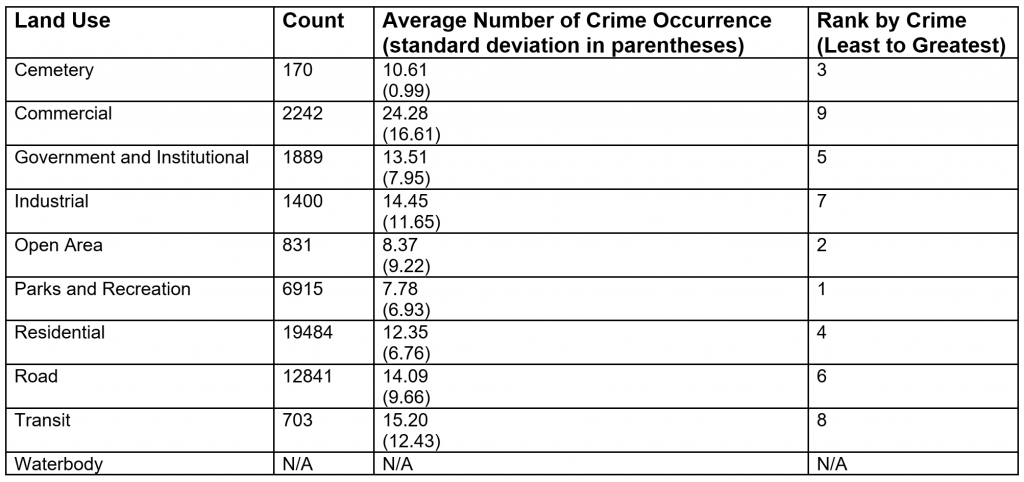
Table 2. Zonal statistics results conducted for land use types. The average number of crimes that occurred in each land use type was determined and then ranked on a scale of 1 – 9. The land use types were assigned values based on their ranking which was later used during the normalization process.
- Reclassifying Data: The four datasets that were used for the first MCE analysis were normalized using the “Fuzzy Membership” tool. This normalizes areas into groups based on whether the areas that are suitable for sky-viewing or not. The datasets were normalized using the following parameters:
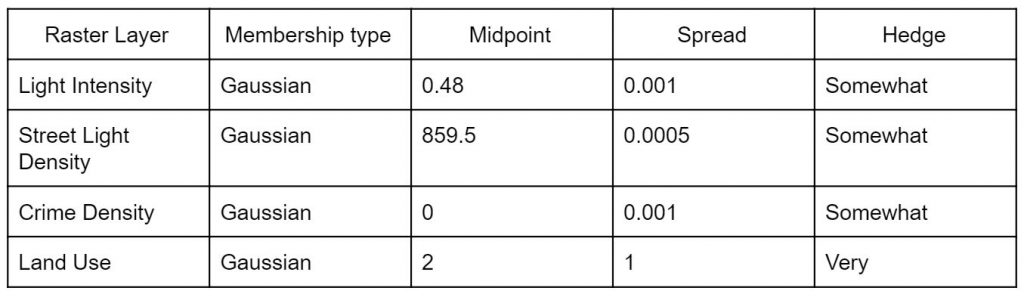
Table 3. The values used in ArcMap’s “Fuzzy Membership” tool. The values were based on values that were the most suitable for sky viewing areas and that was representative of our raw data. In general, areas with low crime and low light intensity were targeted. As streetlights contribute to both safety and light pollution, the midpoint was chosen in the reclassification process.
Part III: Data Clean Up for Least-cost Path
- Creating Source and Destination Points: The source location used, the intersection at Robson St. and Burrard St., was created using latitude and longitude information from Google Maps. A new feature class was created in ArcMap using this location data and used for in the analysis. Destination points, Humm Park, Queen Elizabeth Park and Spanish Banks Beach Park were created by selecting for one park in the parks_lakes layer and exporting the selected polygon into a new feature layer. The process was repeated until each park used in the least-cost path had its own feature layer.
Note: Data parsing and the creation of raster layers can be found in the Methodology section.